Fig. 3.
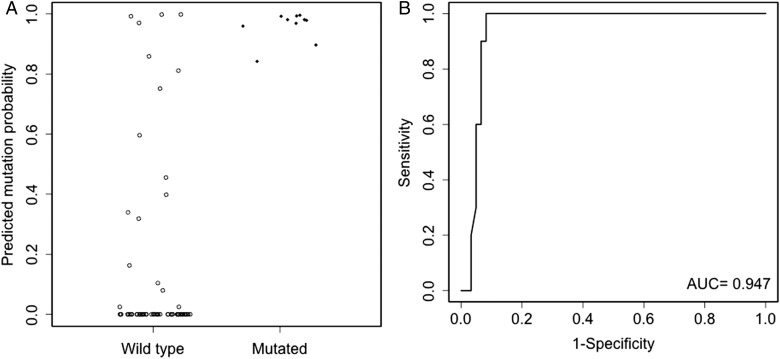
Evaluation of model B in the R132H IDH1 immunonegative subgroup of the validation cohort. The left panel (A) shows model B predicted mutation probabilities for mutated and wild-type patients. The right panel (B) shows the ROC curve of model B. The dots have been jittered for better visualization.

