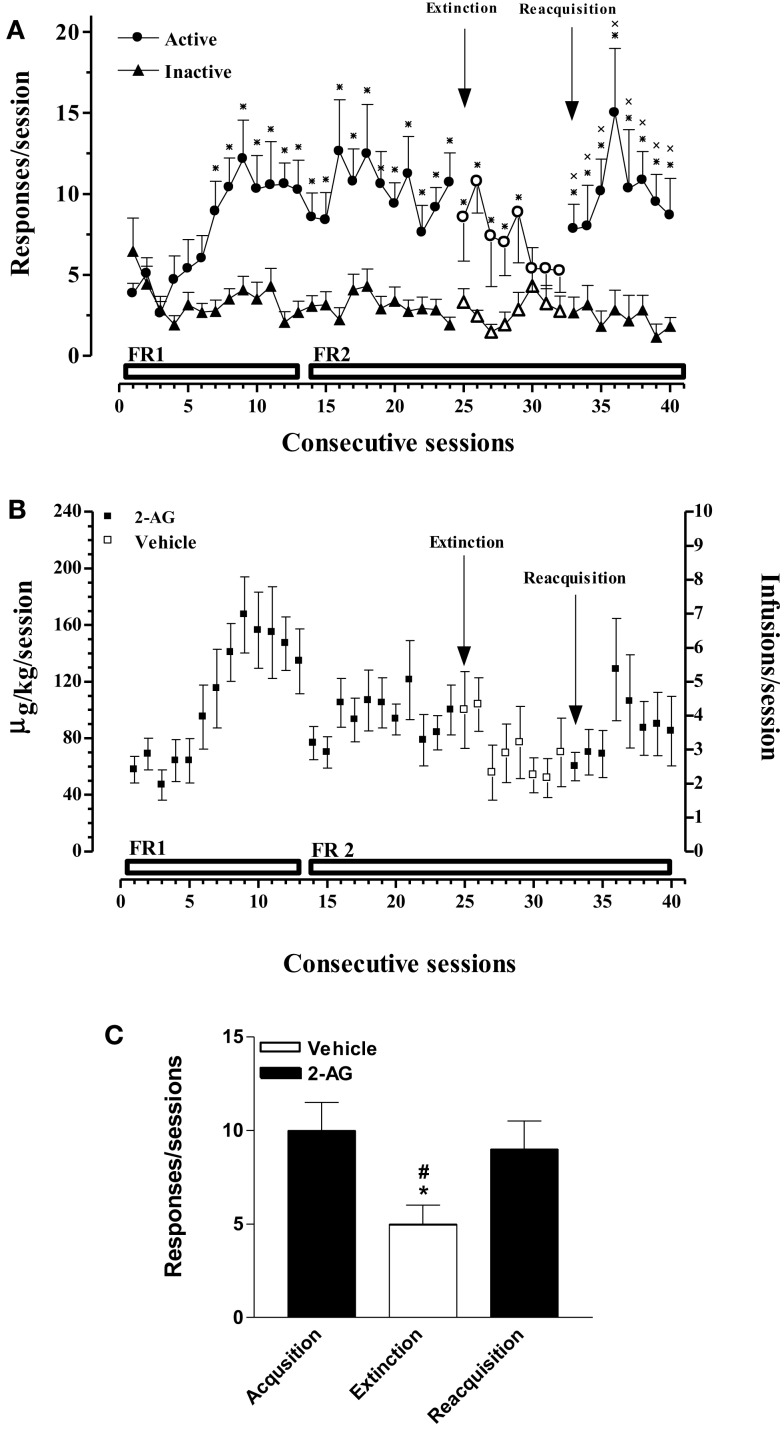
Figure 1.
Acquisition, extinction, and reacquisition of 2-AG self-administration (SA) behavior over consecutive session. (A) Number of responses (nose pokes) for 2-AG SA (25 μg/kg/infusion). Results are expressed as mean ± SEM of nose pokes in the active (circle) and inactive (triangle) holes during each 1-h daily session under FR 1 and FR 2 schedule (acquisition phase: 1st–24th days, filled symbols, N = 13; extinction phase: 25st–32nd days, open symbols, N = 13; reacquisition phase: 33th–40th days, filled symbols; N = 6). *p < 0.05 vs inactive nose pokes; ANOVA followed by LSD post hoc test. (B) Daily intake and number of infusions during 2-AG SA. Data are expressed as μg/kg (left Y-axis) or number of infusions (right Y-axis) of 2-AG during each 1-h daily session (1st–24th; 33th–40th, filled squares) or vehicle (25th–32nd, open squares). (C) Number of responses during each phase of 2-AG SA. Each bar represents the mean ± SEM of the last three sessions under acquisition, extinction, and reacquisition phases of 2-AG SA. *p < 0.05 vs acq.; #p < 0.05 vs reacq. ANOVA followed by LSD post hoc test.

