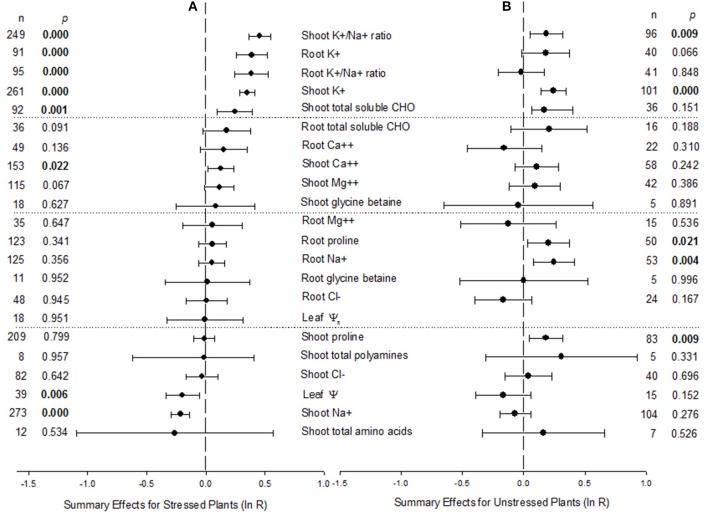
Figure 1.
Weighted summary effect sizes (ln R) and 95% bootstrapped confidence intervals (CIs) for AM effect on plants exposed to NaCl stress (A) and unstressed controls (B). p ≤ 0.05 indicates that the moderator level was significantly different than zero. The absent forest plot for leaf Ψπ in (B) reflects insufficient studies to have included that moderator level in the meta-analysis.

