
Table 1.
Performance comparison (%) among different methods using all the four modalities (i.e., MRI, PET, CSF, and SNP) in terms of “mean ± standard deviation” for binary classification tasks (i.e., positive class vs. negative class).
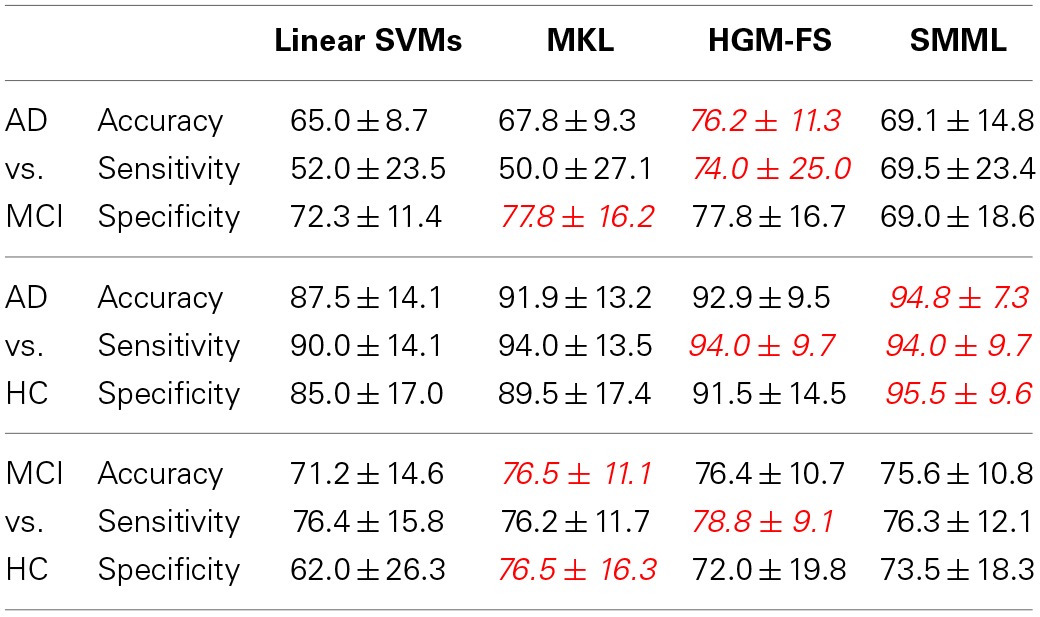
For better comparison, we highlight the best performances using red color.