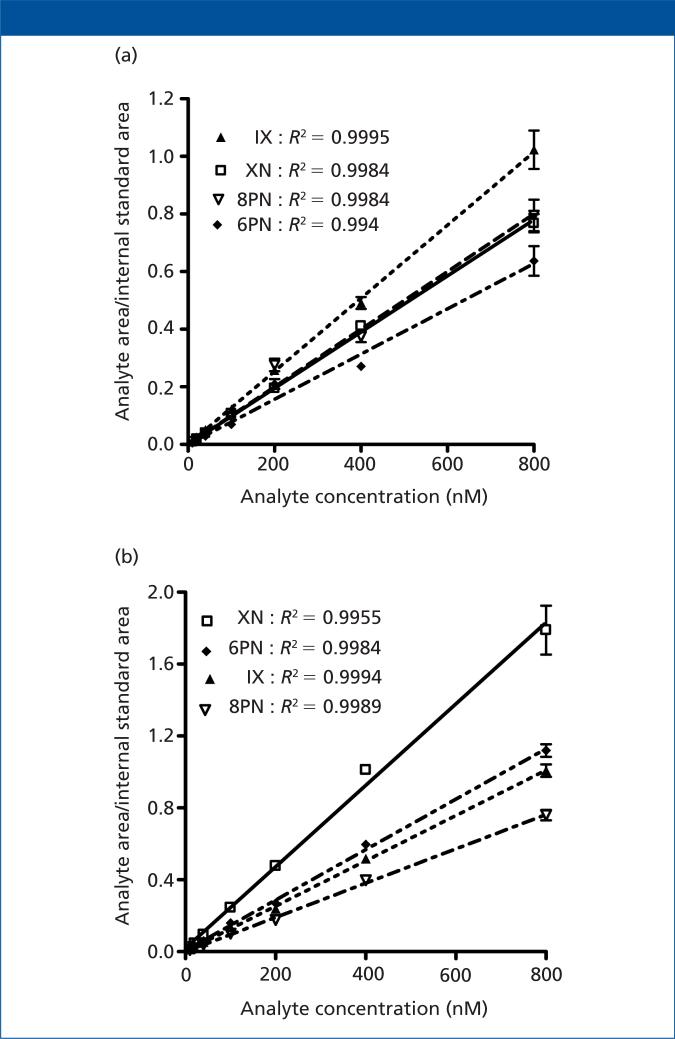
Figure 3.
(a) Human plasma and (b) urine matrix-based calibration curves produced using paper strip extraction before LC–MS-MS analysis of xanthohumol (XN) and its metabolites (isoxanthohumol [IX], 8-prenylnaringenin [8PN], and 6-prenylnaringenin [6PN]). Each concentration level was analyzed in triplicate.

