Fig. 1.
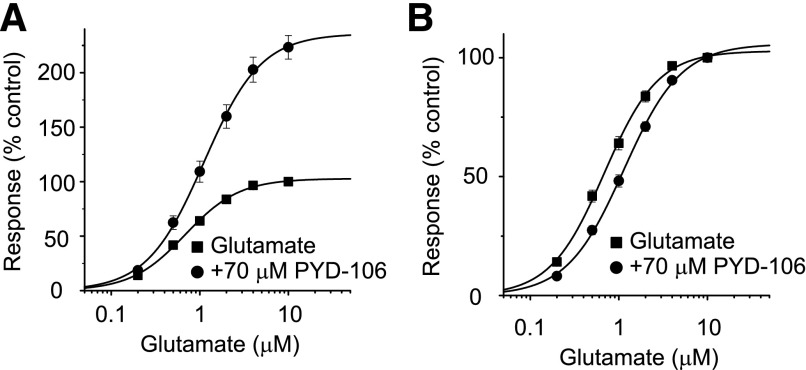
PYD-106 enhances the maximal current response of GluN1/GluN2C receptors. (A) Concentration-effect curves for glutamate are shown recorded in the same oocyte with and without 70 μM PYD-106 (n = 13 oocytes); 30 μM glycine was present in all solutions. All data in PYD-106 are expressed as a percentage of the response to 10 μM glutamate without PYD-106. The smooth curve is a fit of the Hill equation to the data: Response (%) = Maximal Response/[1 + EC50/concentration)N], where EC50 is the concentration of agonist that produces half of the Maximal Response and N is the Hill slope. The fitted maximal response was increased by PYD-106 to 236%. (B) The concentration-effect curves were normalized to the responses at 10 μM glutamate for each and superimposed to more clearly illustrate the shift in glutamate EC50, which was increased by PYD-106 from 0.72 ± 0.05 μM (Hill slope 1.45 ± 0.03) in the absence of PYD-106 to 1.17 ± 0.08 μM (Hill slope 1.39 ± 0.02) in the presence of 70 μM PYD-106 (P < 0.05; t test).

