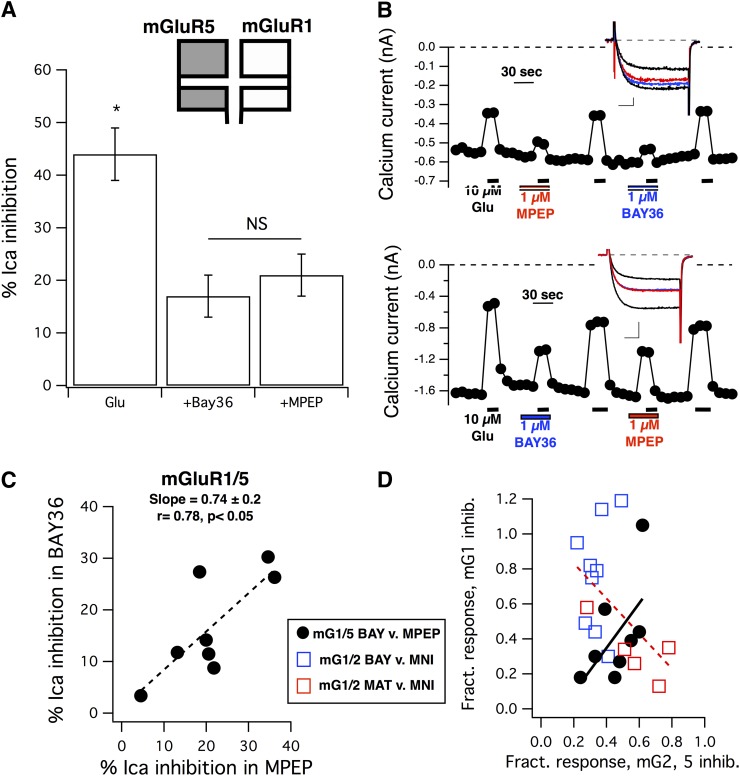
Fig. 4.
Inhibition of the glutamate response by mGluR1 and mGluR5 selective NAMs in SCG neurons expressing mGluR1 and mGluR5. (A) Average (± S.E.M.) calcium current inhibition by 10 µM glutamate in the absence of inhibitors (Glu) and in the presence of either 1 µM BAY36 (+BAY36) or 1 µM MPEP (+MPEP). Asterisk indicates that the control response is statistically distinguishable from the responses in either inhibitor (P < 0.05, analysis of variance). NS indicates that the responses in BAY36 and MPEP are not significantly different. (B) Calcium current amplitude time courses for sample cells showing strong inhibition by both BAY36 and MPEP (upper panel) and weak inhibition by both inhibitors (lower panel). Graphs indicate the time and duration of each drug application. The order of application of the inhibitors (BAY36 and MPEP) was alternated from cell to cell to avoid systematic errors, although responses did not appear to consistently desensitize. Insets show sample control current traces (larger black traces), currents inhibited by 10 µM glutamate alone (smaller black traces), and glutamate inhibited currents in the presence of BAY36 (blue) or MPEP (red). Scale bars in (B) represent 0.1 nA and 5 milliseconds (upper panel) and 0.5 nA and 5 milliseconds (lower panel). (C) Correlation between the magnitude of glutamate responses in the presence of BAY36 and in MPEP in SCG neurons coexpressing mGluR1 and mGluR5, as in (A) and (B). Data were fit to a line function (y = mx + b), with a slope of +0.74 and an r value of 0.78 (n = 8), yielding a statistically significant positive correlation (P < 0.05, Pearson correlation). (D) Positive correlation of the fractional inhibition (inhibition in each drug divided by that of 10 µM glutamate alone in the same cell) in the presence of BAY36 versus that in MPEP in mGluR1/mGluR5-expressing cells [black circles, dotted line, from the same data illustrated in (C)] and in the presence of BAY36 versus that in MNI-137 (blue open squares) or MATIDA versus that in MNI-137 (red squares) in cells expressing mGluR1 and mGluR2. Fit to a line of these combined data illustrating the expected negative correlation is shown as a red dotted line. BAY, BAY36; MNI, MNI-137.

