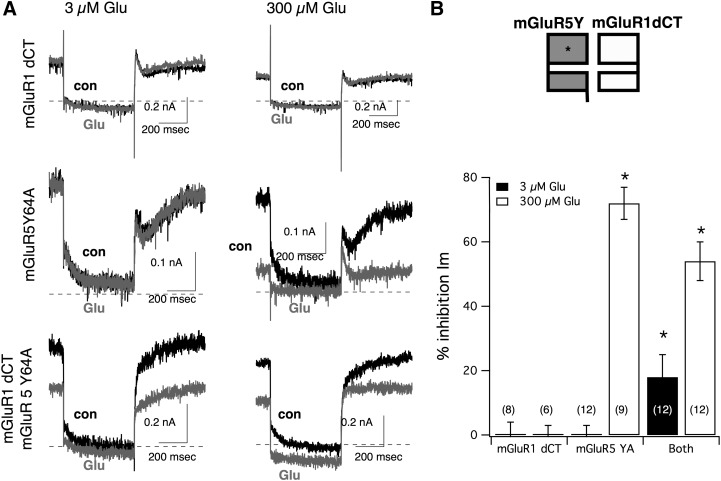
Fig. 7.
Activation of mGluR5 Y64A in trans by mGluR1 dCT at 3 µM glutamate. (A) Sample representative traces illustrating M current from SCG neurons expressing mGluR1 dCT alone (upper panel), mGluR5 Y64A alone (center panel), and both receptors together (lower panel). Each panel shows control, uninhibited currents (black) superimposed with current in the presence (gray) of 3 µM (left) or 300 µM (right) Glu, as indicated. (B) The upper panel illustrates receptor coexpression conditions. The lower panel shows the average (± S.E.M.) glutamate-induced M-current inhibition in SCG neurons expressing the indicated receptors. The number of cells in each group are shown in parentheses. Asterisks indicate P < 0.05 (analysis of variance) versus mGluR1 dCT only and mGluR5 Y64A only controls for the same [glutamate].

