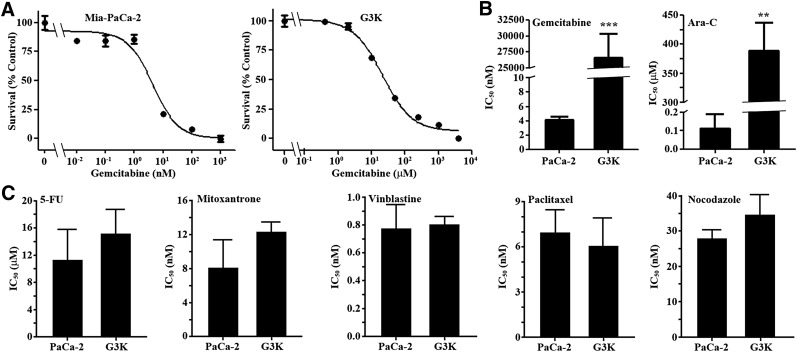
Fig. 1.
Drug-response profiles of MiaPaCa-2 and its derivative G3K cells. (A) Dose response of MiaPaCa-2 and G3K cells to gemcitabine treatment. (B and C) IC50 of MiaPaCa-2 and G3K cells to gemcitabine, Ara-C, 5-FU, mitoxantrone, vinblastine, paclitaxel, and nocodazole (n = 4–8). ***P < 0.001; **P < 0.01.

