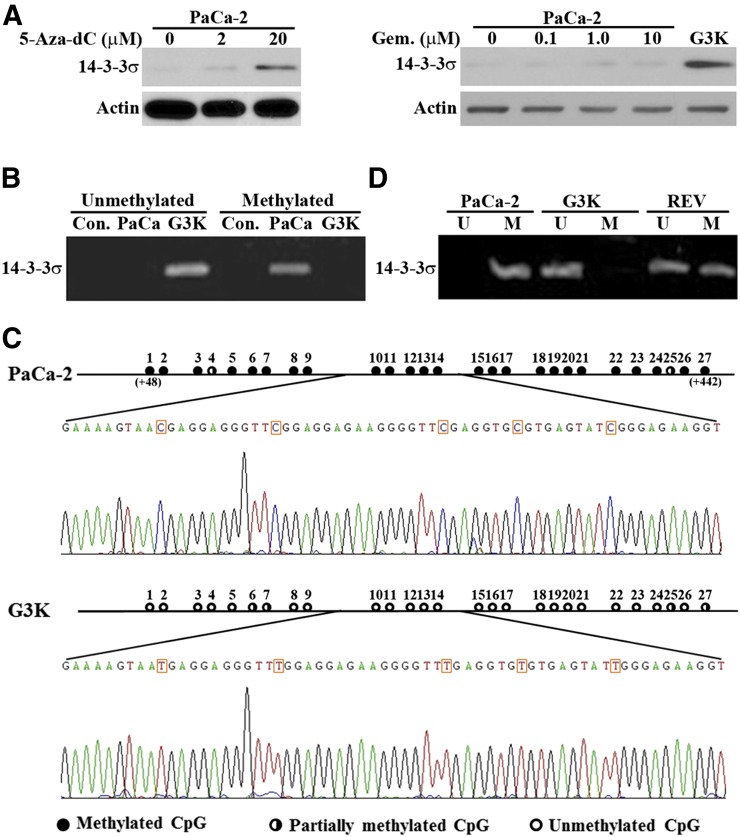
Fig. 4.
Methylation status of the 14-3-3σ gene in MiaPaCa-2 and G3K cells. (A) Effect of 5-Aza-dC or gemcitabine (Gem.) treatment on 14-3-3σ expression. MiaPaCa-2 cells were treated with increasing concentrations of 5-Aza-dC or gemcitabine followed by Western blot analysis of 14-3-3σ and actin loading control. (B) MSP analysis of MiaPaCa-2 and G3K cells. Con., control MSP without genomic DNA input. (C) Sodium bisulfite sequencing analysis of MiaPaCa-2 and G3K cells. The 27 CpG dinucleotides in the first exon of the 14-3-3σ gene are shown with solid circles for fully methylated, open circles for unmethylated, and half-filled circles for partially methylated CpG dinucleotides. The sequence profile containing CpG dinucleotides 10–14 is shown for both MiaPaCa-2 and G3K cells. The numbers in the parentheses indicate the position of the first and last Cs in this CpG island downstream of AUG start codon. (D) Methylation status of the 14-3-3σ gene in the revertant G3K/REV cells. MSP was used to determine the methylation status of the 14-3-3σ gene in G3K/REV cells with MiaPaCa-2 and G3K cells as controls. M, primers for methylated; U, primers for unmethylated.

