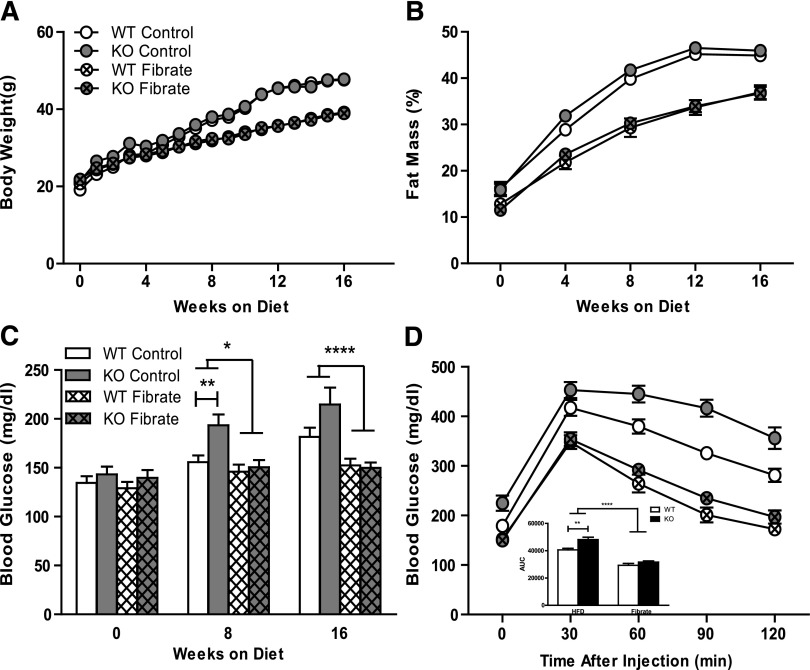
Fig. 4.
Measurement of physiologic parameters. Body weights (A) were recorded for wild-type mice on high-fat diet (WT control, n = 12) and high-fat diet containing 0.05% fenofibrate (WT Fibrate, n = 17), D2 knockout mice on high-fat diet (KO Control, n = 8), and high-fat diet containing 0.05% fenofibrate (KO Fibrate, n = 17). Fat mass percentage (B) of these mice was measured by MRI every 4 weeks (mean ± S.E.M., n = 8∼17). Blood glucose concentrations (C) were measured every 4 weeks (mean ± S.E.M., n = 8∼17). Glucose tolerance tests (D) were performed by intraperitoneal injection of glucose (1 g/kg) and measurement of blood glucose concentration. Area under the curve for the GTT measurement was also listed within (D). Statistical comparison was made between fibrate-treated goups and control groups using two-way analysis of variance. Statistical comparison between genotypes within each group was made using Student test. Asterisks over lines terminating in horizontal bars indicate a significant overall effect of fibrate treatment regardless of genotype. Asterisks over bars terminating in vertical lines indicate a significant difference between genotypes within either fibrate-treated or control groups. *P < 0.05, **P < 0.01, ****P < 0.0001.

