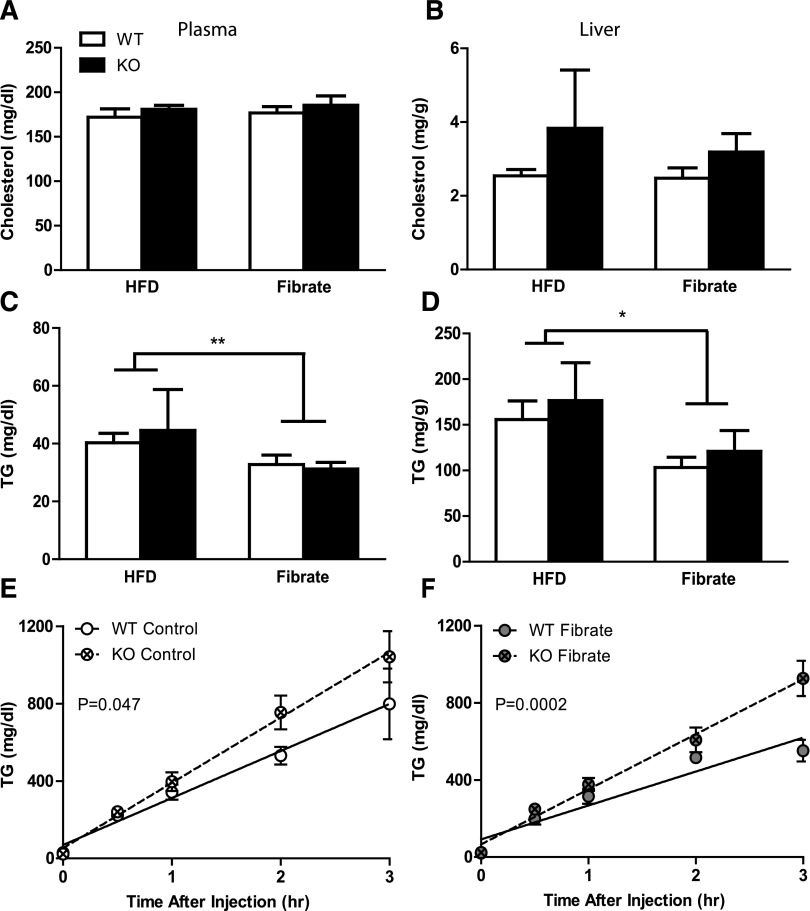
Fig. 5.
Lipid-lowering effect of fibrates dependent on ABCD2. Total cholesterol and triglyceride concentrations in plasma (A and C, respectively, mean ± S.E.M., n = 4∼17) and liver (B and D, respectively, mean ± S.E.M., n = 4∼5) were measured. Statistical analysis was done using two-way ANOVA. Asterisks indicate significant difference between fibrate-treated and control groups regardless of genotype. *P < 0.05, **P < 0.01. (E and F) The TG secretion rate was calculated as the slope, and the significance of difference between two genotypes was demonstrated as P value (control: WT R2 = 0.7453, KO R2 = 0.9187; fibrate: WT R2 = 0.7879, KO R2 = 0.8626).

