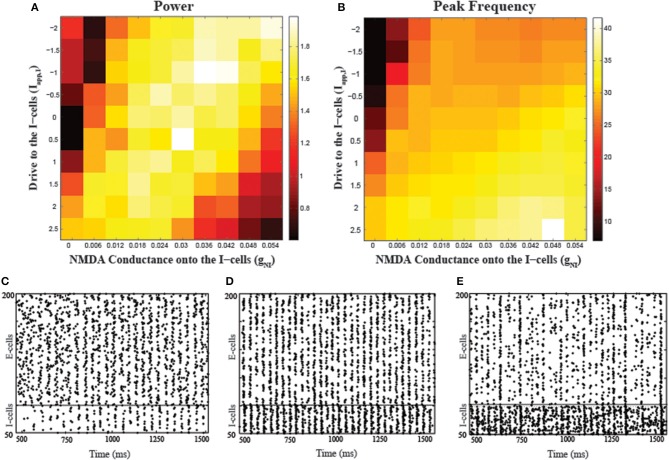
Figure 2.
Effects of varying the NMDA conductance (gNI) and the applied drive to the I-cells (Iapp, I) on network synchronization. (A) The dependence of peak power on the two parameters and (B) peak frequency (in Hz) corresponding to the power values shown in (A). Raster plots showing the network behavior during a portion of the simulation period (500–1500 ms) corresponding to gNI = 0.006 (C), gNI = 0.020 (D), and gNI = 0.054 (E) with Iapp, I = 0.5 in all the conditions.

