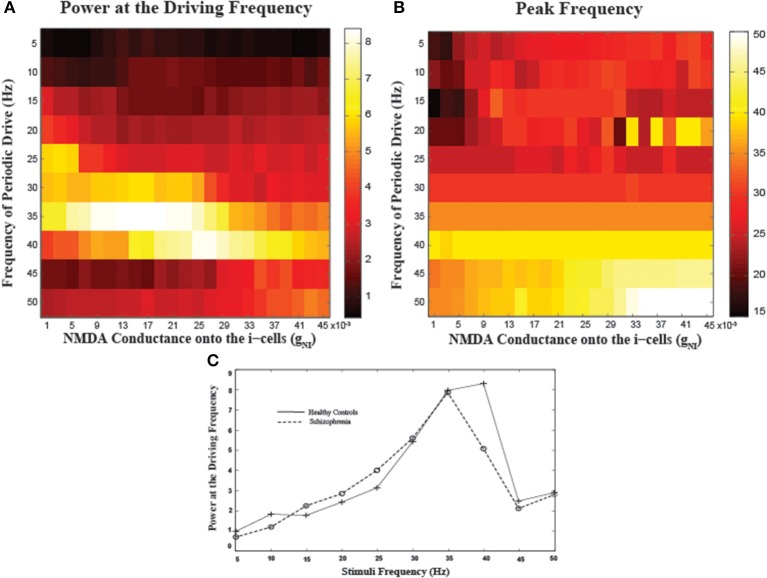
Figure 5.
Network entrainment to periodic stimuli as a function of NMDA conductance onto the I-cells (gNI). (A) The power of oscillations at the driving frequency and (B) the peak frequency of oscillations emerging in the network as a function of a range of gNI values. (C) Spectral plots for representative values of gNI corresponding to healthy controls (gNI = 0.025) and patients with schizophrenia (gNI = 0.007). Note marked reductions in spectral power for patients specifically at 40 Hz.

