
Figure 3. Effects of LY294002 and duck FST overexpression on myoblast proliferation.
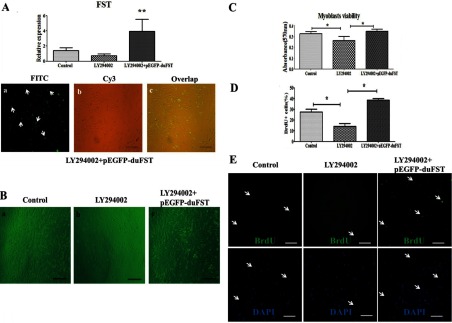
(A) The relative mRNA expression of FST; including the control group, treatment with LY294002 for 24 h (designated as LY294002 group), transfected with pEGFP-duFST for 24 h after 24 h LY294002 treatment (designated as LY294002+pEGFP-duFST group), the data were analysed by ANOVA and Tukey's test, The label ‘**’ indicates a significant difference (P<0.01). The transfection efficiency of LY294002+pEGFP-duFST group was observed using a fluorescence microscope (×100). (B) Representative images of myoblasts for different treatments groups, (a) control group, (b) LY294002 group, (c) LY294002+pEGFP-duFST group (×100). (C) Proliferation myoblasts was measured by MTT assay, data are presented as the mean±S.E., n=5 wells,*(P<0.05). (D) The number of BrdU–FITC-labelled nuclei per 100 DAPI-labelled nuclei. (E) BrdU-labelled nuclei for different treatments group; all of the nuclei are labelled blue by DAPI, but only the proliferating nuclei are labelled green by monoclonal anti-BrdU (×200), the arrows show the proliferation cells.