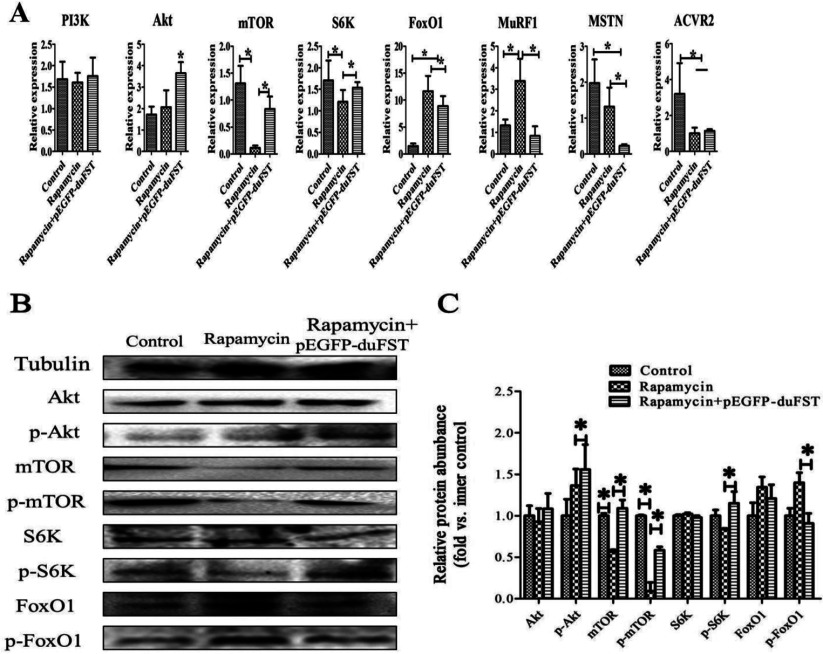
Figure 6. Effects of rapamycin and duck FST overexpression on PI3K/Akt/mTOR signalling.
(A) The relative mRNA expressions of PI3K, Akt, mTOR, S6k, FoxO1, MuRF1, MSTN and ACVR2 were detected by qRT-PCR and included different groups: control group, rapamycin group and rapamycin+pEGFP-duFST group. The data were analysed using ANOVA and Tukey's test. The label ‘*’ indicates a significant difference (P<0.05). The results are presented as the mean±SEM (n=3). (B, C) The expression of Akt, phospho-Akt (Thr308) (p-Akt), mTOR, phospho-mTOR(serine 2448) (p-mTOR), S6K, phospho-S6K (Ser417) (p-S6K), FoxO1, phosphor-FoxO1 (Ser256) (p-FoxO1) proteins were detected by Western blot and included different groups: control group, rapamycin group and rapamycin+pEGFP-duFST group. Tubulin was used as the internal group. Each treatment and each sample were repeated in triplicate, the expression of eight proteins were normalized to the equal a value of 1 in control, *represents a significant difference (P<0.05).

