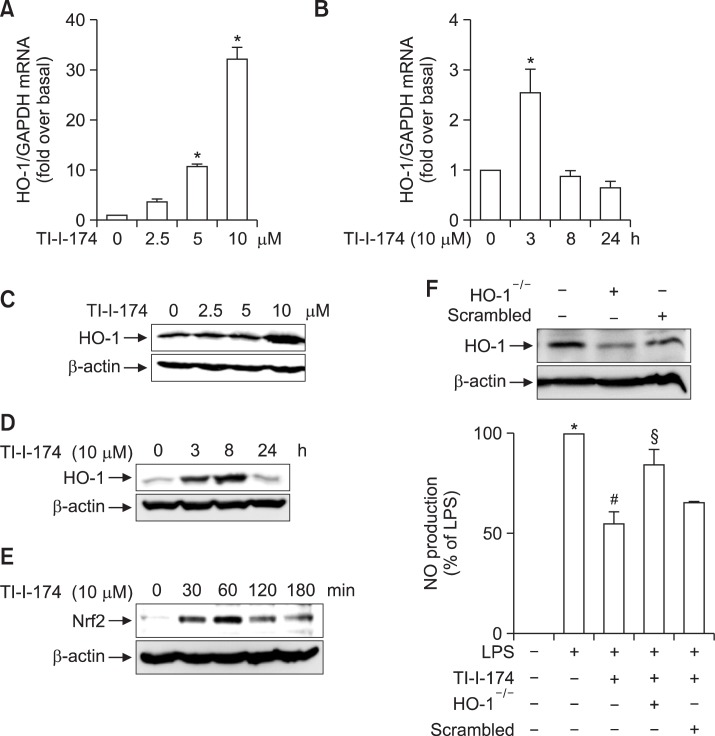
Fig. 8.
Role of HO-1 induction in the suppression of LPS-stimulated nitrite production in RAW 264.7 macrophages. (A) and (B) Cells were pretreated with TI-I-174 for the indicated concentrations (A) or time periods (B). HO-1 mRNA level was measured by qRT-PCR and normalized to GAPDH mRNA as described previously. Values are presented as mean ± SEM (n=3). *p<0.05 compared with control cells. (C) and (D) Cells were treated with the TI-I-174 for the indicated concentrations (C) or time periods (D). HO-1 expression was determined by Western blot analysis as described in material and methods. Representative image from three independent experiments is shown along with β-actin for internal loading control. (E) Cells were treated with TI-I-174 for the indicated time periods. Nrf2 protein expression in total cellular lysates was measured by Western analysis. β-actin was used for internal control. Images are representative of three independent experiments that showed similar results. (F) (Upper panel) Cells were transfected with siRNA targeting HO-1 or scrambled (25 nM). After 48 h incubation, expression level of HO-1 was determined by Western blot analysis. (Lower panel) Cells were transfected with siRNA targeting HO-1(25 nM) or scrambled siRNA. After 6 h incubation, media were replaced with DMEM containing 10% FBS and then further incubated for 22 h. Cells were incubated with TI-I-174 (10 μM) for 1 h followed by stimulation of LPS (100 ng/ml) for additional 24 h. NO production was determined as described previously and values are presented as fold change relative to control cells and expressed as mean ± SEM (n=4). *p<0.05 compared with control group; #p<0.05 compared with cells treated with only LPS; §p<0.05 compared with the cells treated with TI-I-174 and LPS.

