Fig. 4.
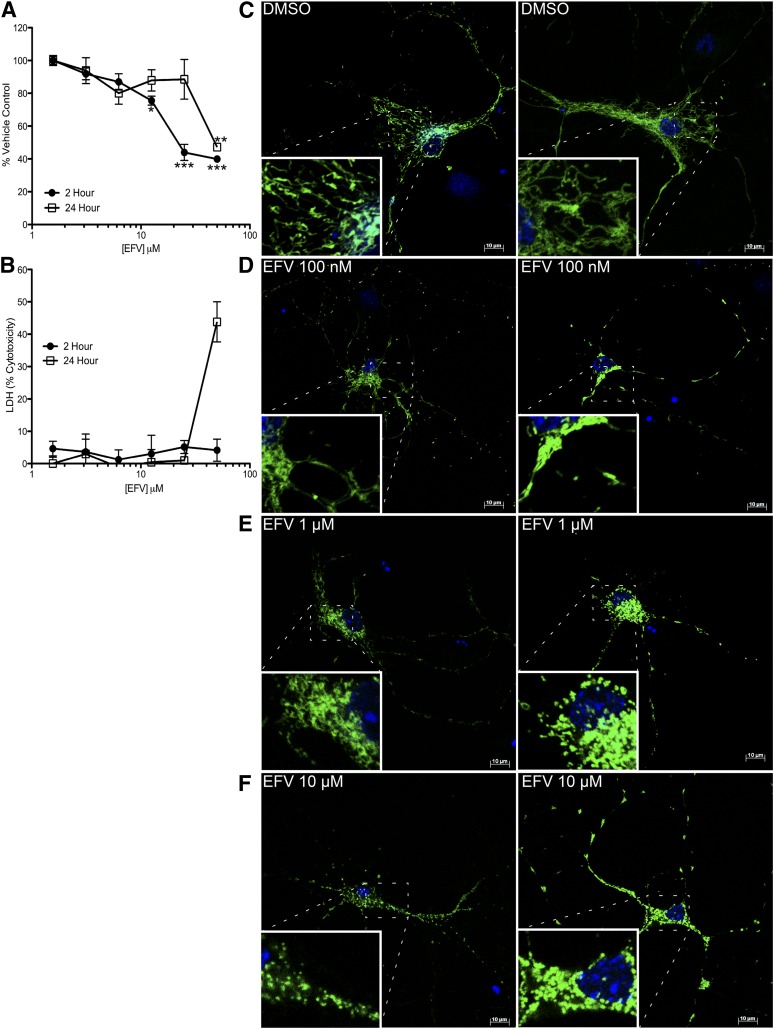
ATP production and mitochondrial morphology in rat striatal neurons with EFV. (A) ATP assay in primary rat striatal neurons treated with 50, 25, 12.5, 6.25, 3.125, and 1.5 μM EFV for 2 and 24 hours. (B) LDH assay of rat striatal neurons treated with the same doses of EFV for 2 and 24 hours. (C–F) Confocal images of primary rat striatal neurons treated with the indicated doses of EFV for 2 hours with MitoTracker green for the last 15 minutes of treatment. Note the change of mitochondria to more fragmented morphology (bars = 10 µm). *P < 0.05; **P < 0.01; ***P < 0.001 compared with vehicle-treated neurons, one-way analysis of variance followed by Dunnett’s post tests.

