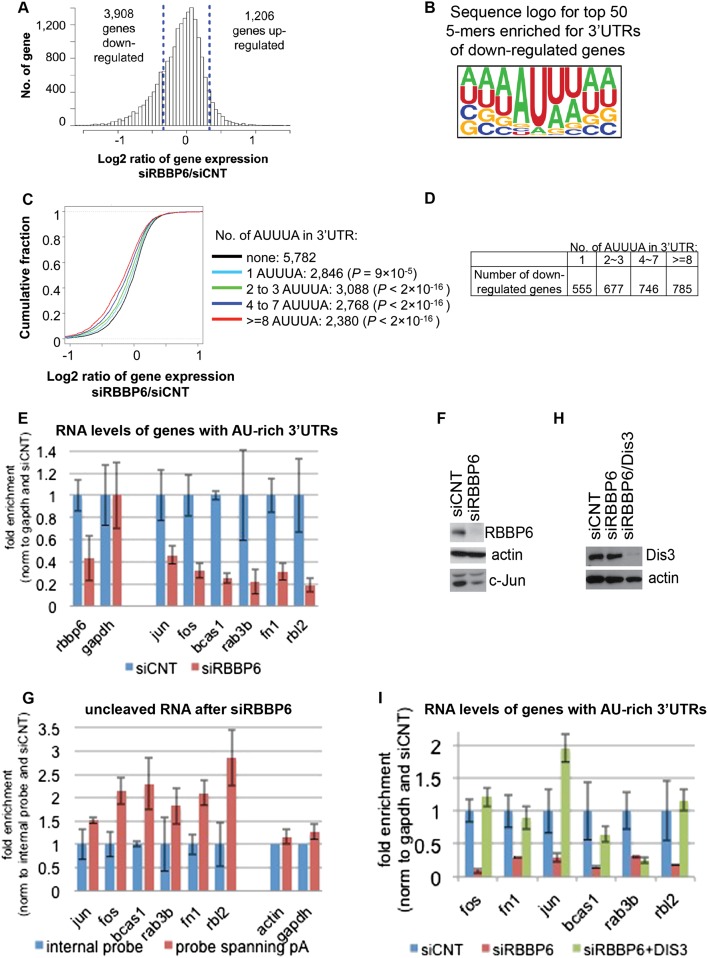
Figure 5.
RBBP6 knockdown leads to down-regulation of ARE-containing transcripts. (A) Histogram for gene expression changes based on microarray data of MCF-7 cells after siRNA to RBBP6 (siRBBP6) or nontargeting sequence (siCNT). Dotted lines indicate one standard deviation value of gene expression changes. (B) Sequence logo of top 50 pentamers associated with the 3′ UTRs of down-regulated genes. Pentamer sequences are shown in Supplemental Figure 4C. (C) Cumulative fraction analysis of genes with different numbers of AREs in the 3′ UTR. The Kolmogorov-Smirnov (KS) test P-value for difference in data distribution between genes with AREs and those without is indicated. (D) The table shows the number of down-regulated genes based on AUUUA repeats in the 3′ UTRs. (E) RNA was extracted from MCF-7 after siRBBP6 or siCNT, and RT-qPCR was used to calculate the relative amount of the indicated transcripts as normalized to siCNT and gapdh. (F) Western blot with the indicated antibodies after knockdown of RBBP6 in MCF-7 cells. (G) RNA was extracted from MCF-7 after siRBBP6 or siCNT, and RT-qPCR was used to calculate the relative amount of the indicated uncleaved transcripts using primers spanning the last poly(A) site of each gene and normalizing to siCNT and an internal probe for each gene. (H) Western blot with the indicated antibodies after knockdown of RBBP6 or RBBP6 and Dis3 in MCF-7 cells. (I) RNA was extracted from MCF-7 after siCNT,siRBBP6, or siRBBP6 together with siDis3. RT-qPCR was used to calculate the relative amount of the indicated transcripts as normalized to siCNT and gapdh. For all RT-qPCR analyses, results from three independent experiments are shown, represented as mean and standard error.

