Figure 2.
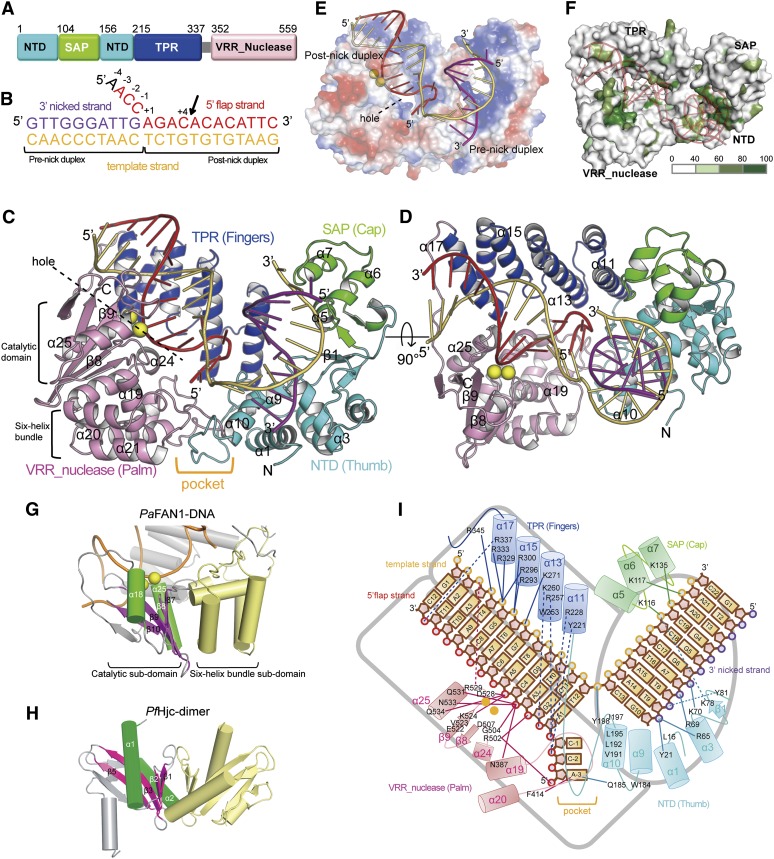
Overall structure of the PaFAN1–DNA complex. (A) Schematic diagram of the domain organization of PaFAN1. (B) The 4-nt 5′ flap DNA used in crystallization. In the text, each nucleotide is numbered from the 5′ end of the 3′ nicked or template strand. For the 5′ flap strand, each nucleotide is numbered from the junction. The substrate is labeled prenick and post-nick duplex based on the 3′ nick position. The three strands are labeled as 3′ nicked strand (purple), 5′ flap strand (red), and template strand (orange). The cleavage site is marked with an arrow, and the terminal nucleotide (A-4; black) in the 5′ flap strand is disordered in the structure. (C) A ribbon representation of PaFAN1 showing the NTD (cyan), the SAP domain (green), the TPR domain (blue), and the VRR nuc domain (pink). The 3.2 Å PaFAN1–DNA structure is shown in C–I and Figure 3, A–D, and metal ions are modeled from the superimposed 4.0 Å metal-bound structure. The 5′ flap DNA is shown in purple for the 3′ nicked strand, red for the 5′ flap strand, and orange for the template strand. Active site metal ions are shown as yellow spheres. The pocket for 5′ flap binding is marked with an orange label. See Supplemental Movie 1. (D) Alternative view of the complex shown in C. (E) Corresponding view of the complex shown in C, presented as an electrostatic color-coded surface representation. (F) FAN1 is colored according to the degree of conservation in the FAN1 orthologs of 13 species shown in Supplemental Figure 1. More conserved residues are colored deep green. The view is the same as that in D. (G) Overall structure of the VRR nuc domain of PaFAN1. The six-helix bundle subdomain (yellow) is connected to the catalytic subdomain. Helices α18 and α25 of PaFAN1 are shown in green, and the four strands (β7–β10) are shown in magenta. The helices in gray are from the TPR domain. (H) Dimer structure of the archaeal HJ resolvase (PfHjc). Helices and strands of PfHjc corresponding to PaFAN1 are also shown in green and magenta. (I) Molecular details of the PaFAN1–DNA interaction. Hydrogen bonds and ion pairs between FAN1 and the DNA molecule are indicated by arrows. Mn2+ ions are shown as orange spheres.

