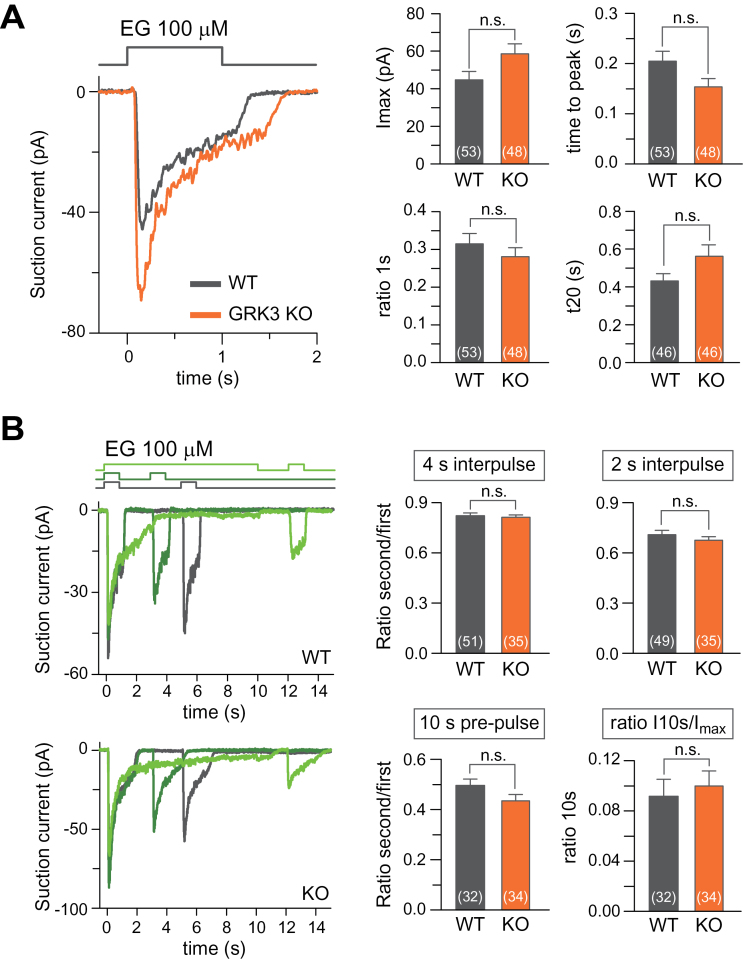
Figure 4.
Response properties of mOR-EG-expressing OSNs which lack GRK3. Odorant responses were recorded from GFP-positive OSNs using the suction pipette technique. (A) Left panel: Response of wild-type (black) or GRK3–/– (orange) OSNs to 100 µM EG. Right panels plot the averages of the maximal current (I max), the ratio of the current at 1s normalized to the peak current (ratio 1s), the time required of the maximal current to peak from the onset of stimulation (time to peak) and the time it takes for the current to fall to 20% of its value measured at the end of stimulation at 1 s (t20). (B) Repeated stimulation of wild-type and GRK3–/– OSNs. OSNs were exposed twice to 100 µM EG as indicated by the solution monitors at the top. Right panels: The response of the second exposure was normalized to the first for each OSN for the 4 s and 2 s interpulse periods and also when the first odorant exposure lasted 10 s (10 s prepulse). “Ratio I10s/ I max” is a measure of the decline of the response during the 10-s prepulse. Plotted are mean ± SEM, numbers in parenthesis are OSNs recorded from, “n.s.” not significant.

