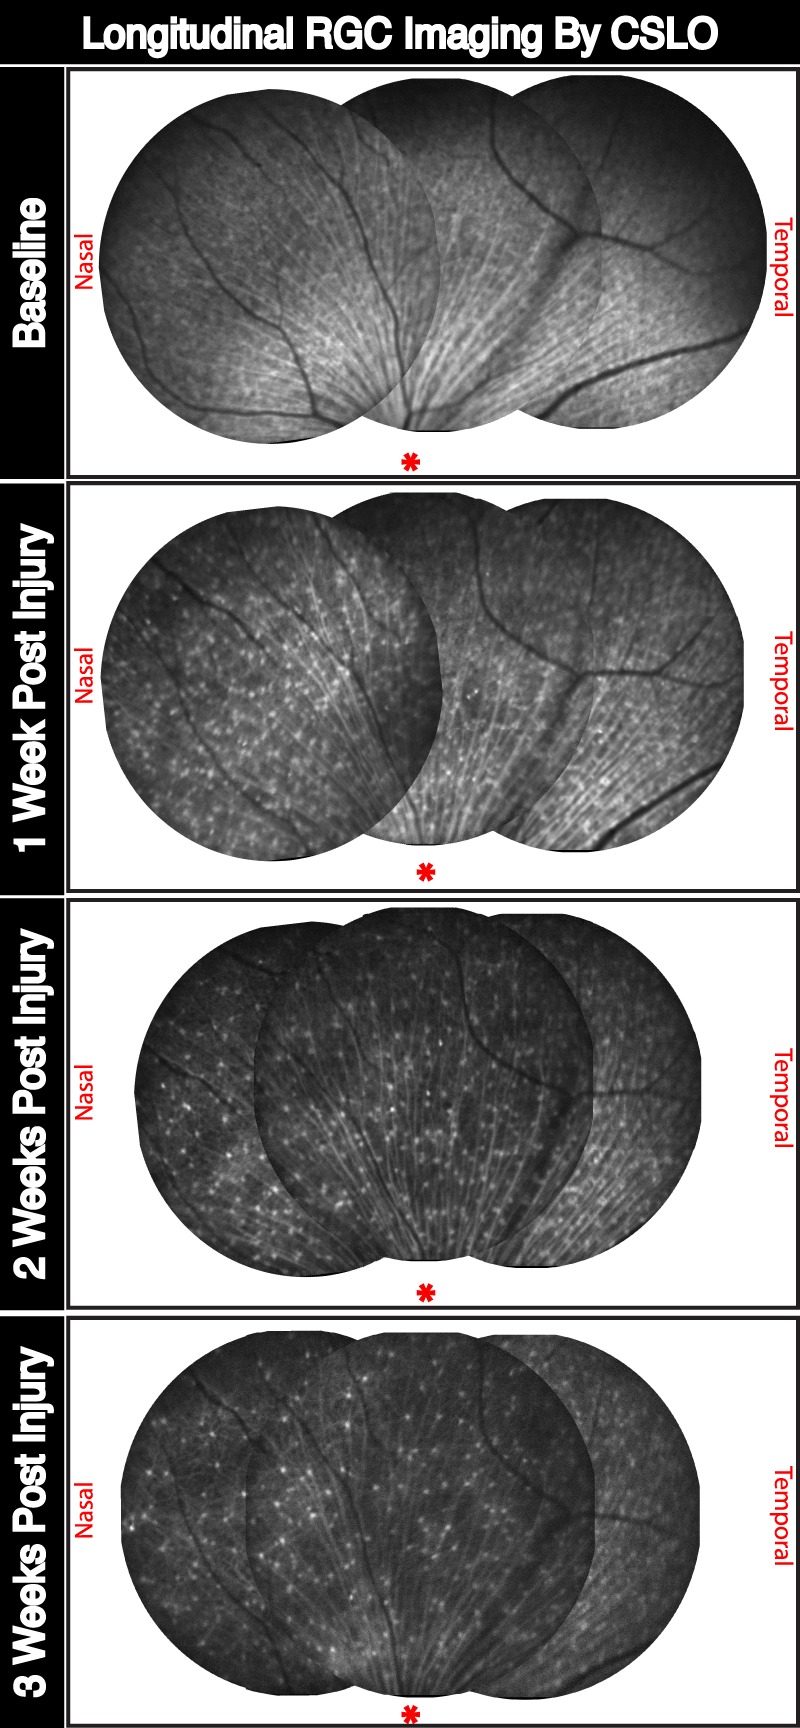
Figure 3.

In vivo longitudinal and topographic assessment of neurodegenerative progression following ONC injury of adult RGC by CSLO imaging. Representative fundus images tracking longitudinal RGC density for a single mouse retina following ONC injury. Images were taken before, and 1, 2, and 3 weeks after injury. Tiled images represent a topographical view of the superior aspect of the retina followed longitudinally using vascular morphology as reference points. *Approximate location of the optic nerve head for reference. Nasal and temporal sides are labeled accordingly.
