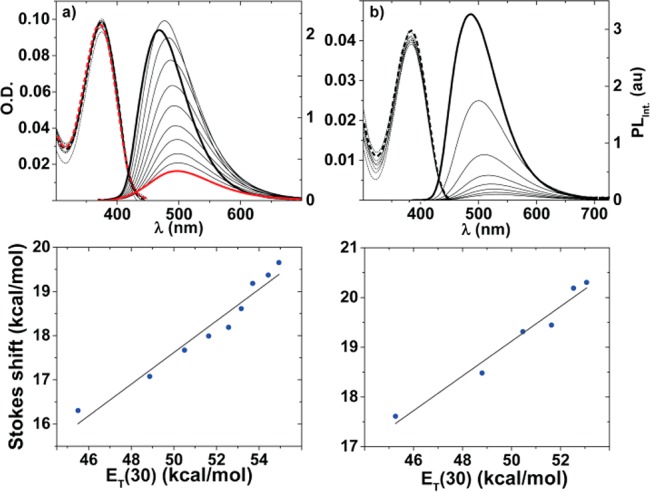
Figure 4.

(a,b) Assessing the effect of solvent polarity on absorption (dotted line) and emission (solid line), in dioxane (bold black line), methanol (bold red line), and their mixtures (black lines) for 1c (6.7 × 10⁻⁶ M) and 1d (2.0 × 10⁻⁶ M); respectively.25 (c, d) Correlating Stokes shift vs ET(30) values obtained from dioxane–methanol mixtures for 1c (90%:10% → 10%:90%; slope: 0.36 and R2 = 0.95) and 1d (90%:10% → 40%:60%; slope: 0.35 and R2 = 0.98).25 Experimental errors are smaller than the data symbols; see SI for enlarged correlations (Figures S8.1 and S8.2).
