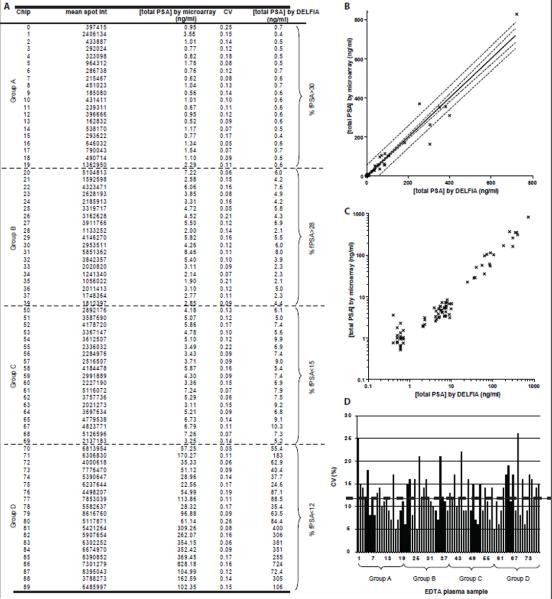
Fig 4.
4A: Mean spot intensities, CVs, and total PSA concentrations derived from the total PSA microarray and the sigmoid curve fit, with the corresponding total PSA concentration by DELFIA. 4B: The total PSA concentrations derived from the antibody microarray assay plotted against the DELFIA reference values. The dashed lines outline: the 95 % confidence interval (inner lines) and the 95 % prediction interval (outer lines). 4C: Total PSA concentration by antibody microarray plotted against total PSA concentration by DELFIA using a logarithmic scale on both axes. 4D: Coefficients of variation in microarray readout for the 80 clinical plasma samples. The mean CV (12 %) is represented by the dashed line.

