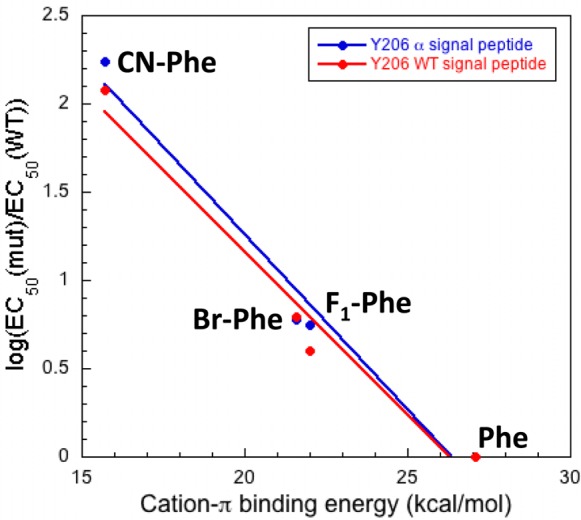
Figure 3.

Plot of cation−π binding energy vs mutant receptor loss-of-function at Y206. A linear trend is indicative of an electrostatic interaction with the face of the residue examined. Data for both the wild type and α signal peptide-containing templates are plotted together and indicate no effect of altering the signal peptide on receptor function.
