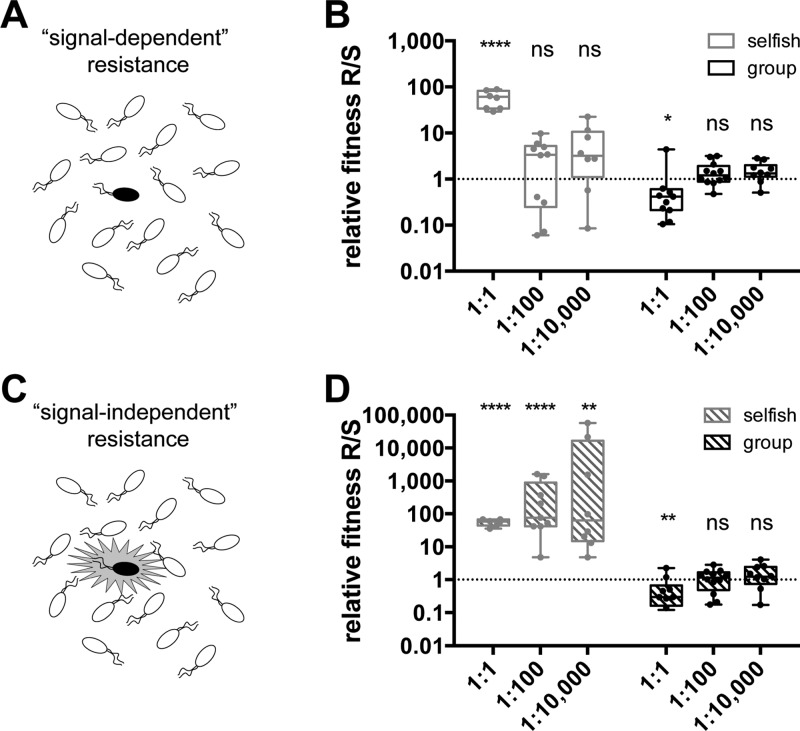
Figure 4.
Relative fitness of resistant (R) versus sensitive (S) mimic strains. R and S were grown in coculture with selfish phenotype selection (adenosine carbon source, gray) and group-beneficial phenotype selection (BSA carbon source, black). (A) Schematic demonstrating a nonquorate rare signal-dependent QSI-resistant mutant. (B) Relative fitness of signal-dependent R vs S. (C) Schematic demonstrating a signal-independent QSI-resistant mutant that can express its QS regulon, even when rare. (D) Relative fitness of signal-independent R vs S. Relative fitness values >1 indicate that the resistant mimic is more fit and will spread. Data are represented as box and whisker plots. Each dot is an individual data point. Boxes encompass the inner quartiles, and horizontal lines are median values. Whiskers extend to the furthest data points. The statistical significance of relative fitness deviations from 1 were tested via paired t tests comparing the logarithm of the final R/S ratio to the logarithm of the initial R/S ratio for each sample (****p < 0.0001, ***p < 0.001, **p < 0.01, *p < 0.05, not significant (ns) p > 0.05).

