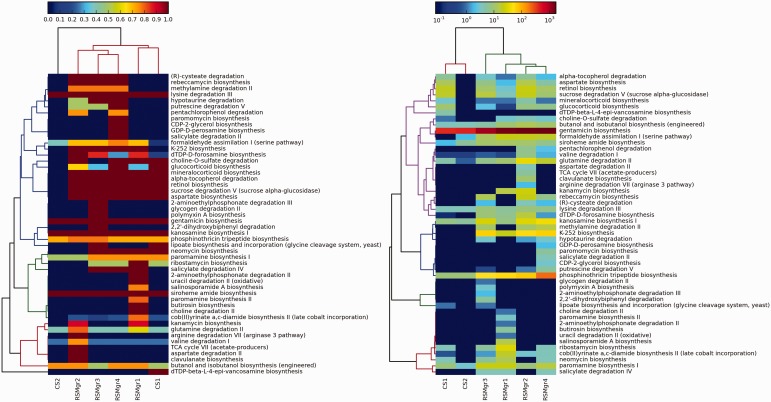
Figure 3.
Values in the left panel are pathway completeness estimates. The values in the right panel are the total hits for each pathway that was normalized against its completeness. A minimum completeness of 75% was applied to both panels, where at least one sample had to satisfy for each pathway. The left panel demonstrates the presence or absence of selected pathways in the mangrove samples vs the control data sets, whereas the right panel shows the enrichment of these pathways.

