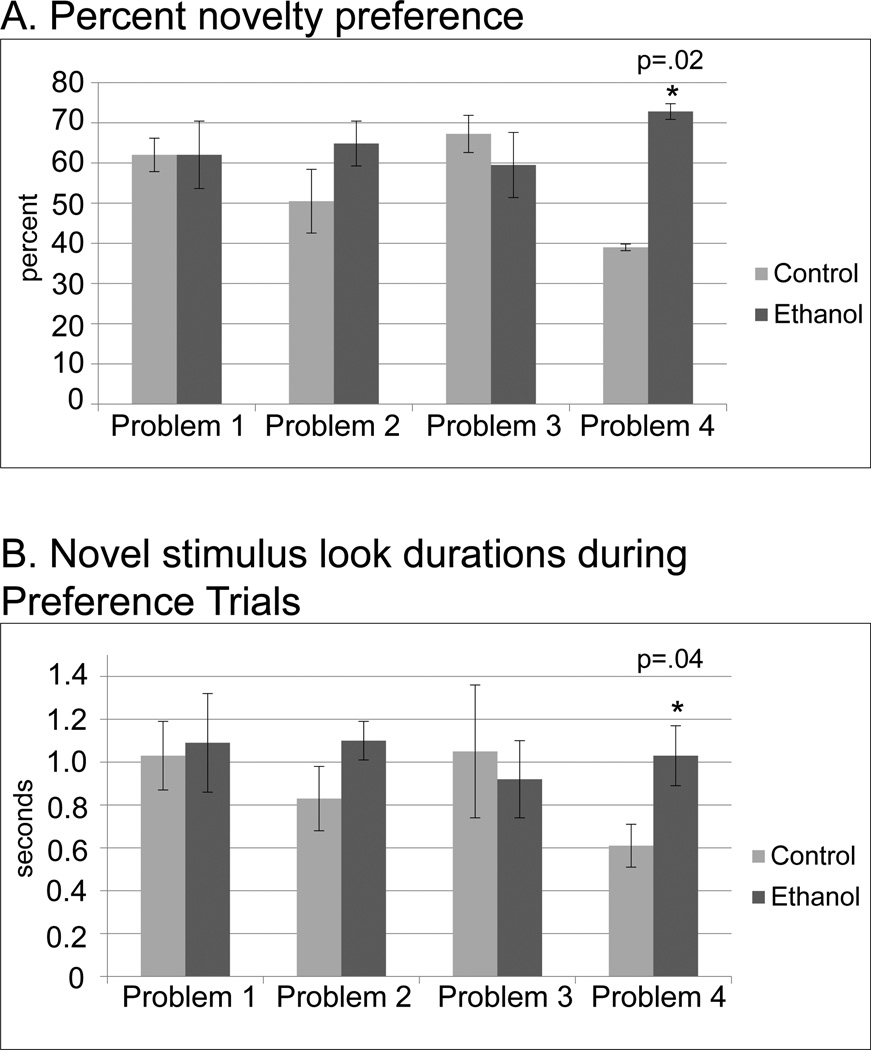
Figure 2.
Visual Paired Comparison. A. Group comparison of percent novelty preference, the percent time looking at the novel stimulus of total looking time during two preference trials for each stimulus pair. B. The average duration of each individual look at the novel stimulus during two preference trials for each stimulus pair. See legend Figure 1.

