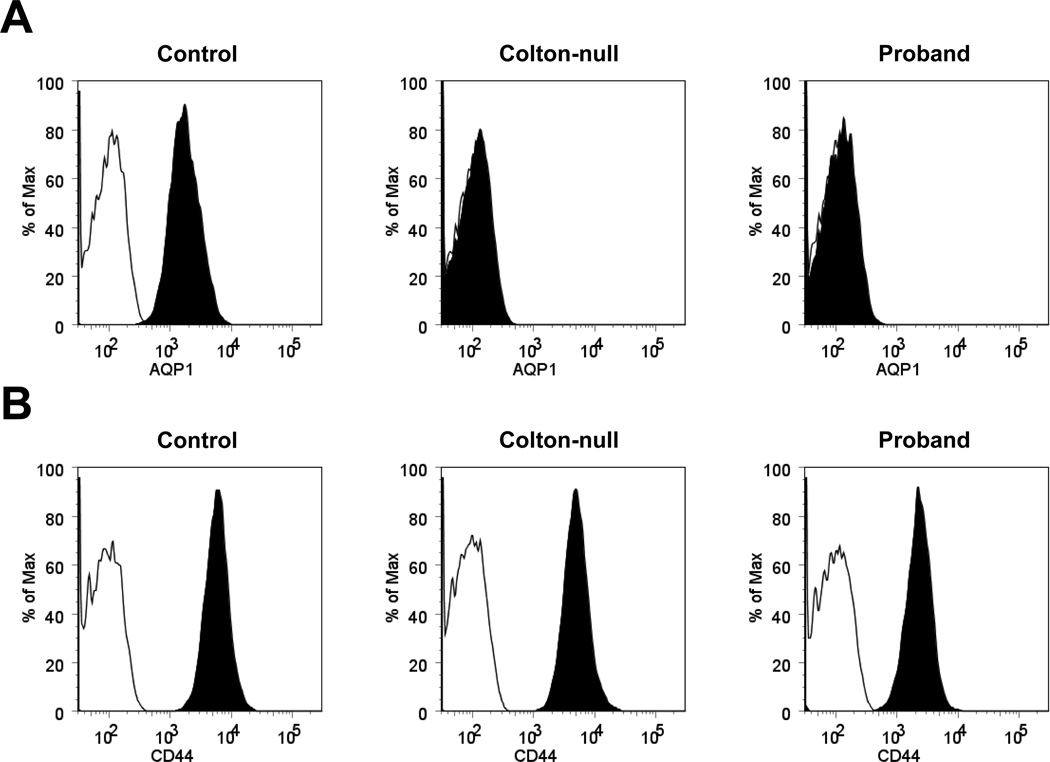
Figure 3. Flow cytometry analysis of AQP1 and CD44 in the proband’s RBCs.
Intracellular staining of AQP1 (A) and extracellular staining of CD44 (B) in the RBCs of a control donor (left overlays), a previously characterized Conull subject (SAR, middle overlays) and the proband (right overlays) analyzed by flow cytometry; black histograms correspond to the staining with anti-AQP1 or anti-CD44, and white histograms to the isotype control.

