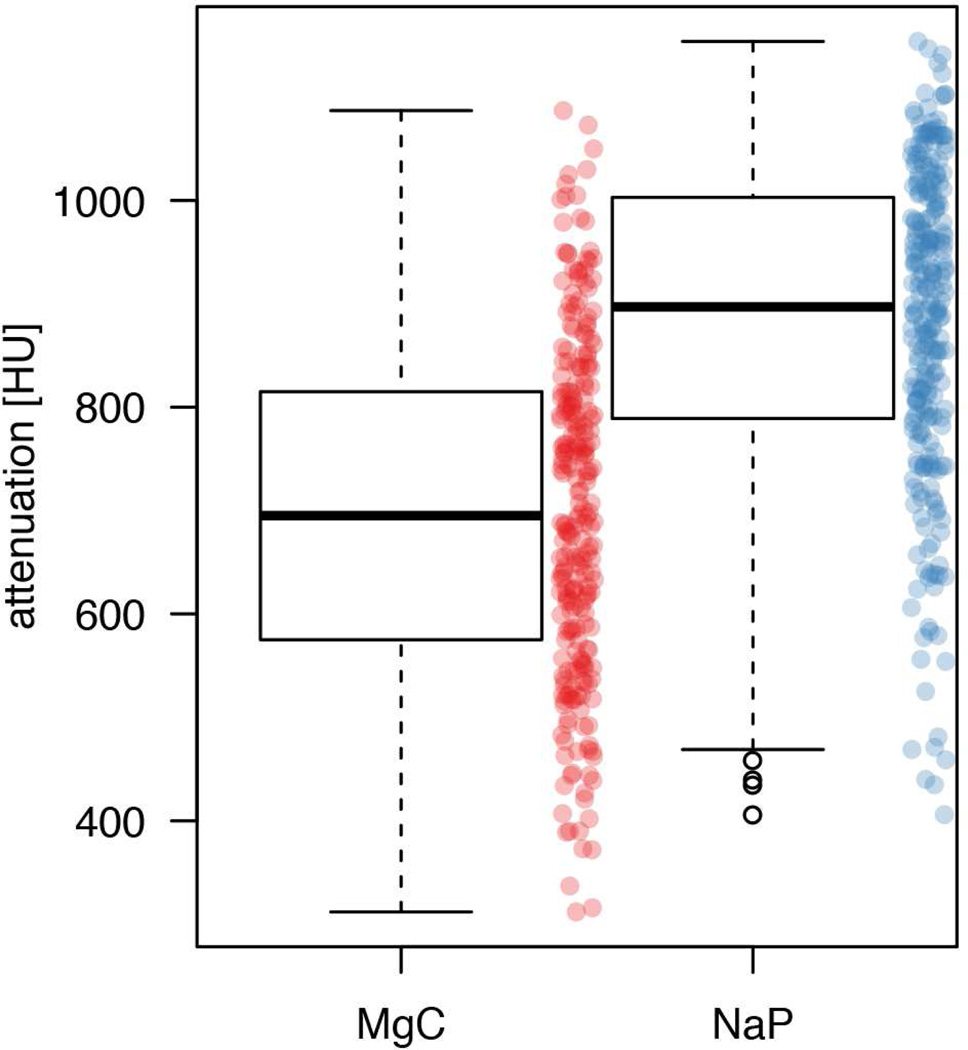
Figure 3.
Residual colonic fluid attenuation following the NaP regimen versus the MgC regimen in all 250 patients. Box and whisker plots show the median (thick line) and the box spans the interquartile range (IQR; Q1 to Q3); the whiskers extend to the most extreme observation within 1.5 times the IQR, and observations beyond that range are plotted individually. To give a better idea of the distribution of all individual measurements, these are also shown (red for MgC and blue for NaP). Automatically quantified attenuation of residual colonic fluid was significantly lower for the MgC regimen (700±165 HU) than for the NaP regimen (878±155 HU; p<0.001).

