
Figure 4.
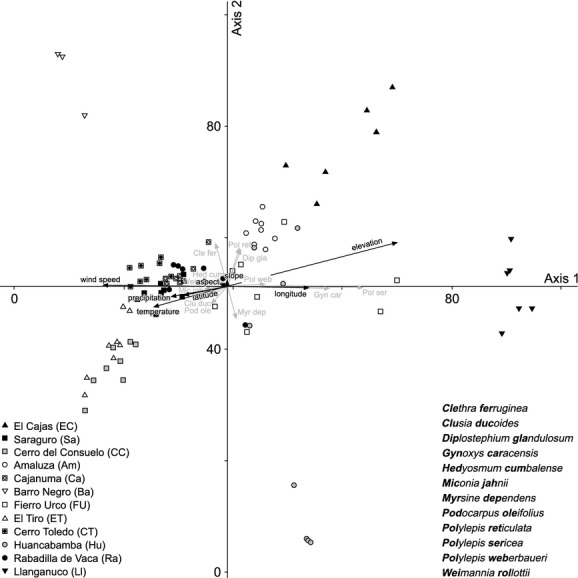
Detrended correspondence analysis (DCA) showing the floristic similarity of the investigated study sites. The most important indicator species as well as side factors were shown by gray and black arrows, respectively. Total variance 15.01; axis 1 eigenvalue = 0.87 (gradient length 4.344); axis 2 eigenvalue = 0.70 (gradient length 6.553).