
Figure 1.
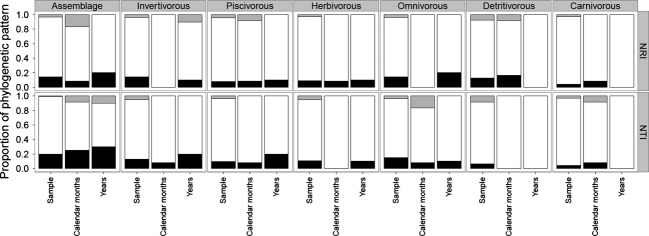
Proportion of phylogenetic patterns observed for assembly and functional groups. The bar-color indicates the phylogenetic patterns (Gray – Phylogenetic overdispersion; White – Random; and Black – Phylogenetic clustering).
Official websites use .gov
A
.gov website belongs to an official
government organization in the United States.
Secure .gov websites use HTTPS
A lock (
) or https:// means you've safely
connected to the .gov website. Share sensitive
information only on official, secure websites.
Proportion of phylogenetic patterns observed for assembly and functional groups. The bar-color indicates the phylogenetic patterns (Gray – Phylogenetic overdispersion; White – Random; and Black – Phylogenetic clustering).