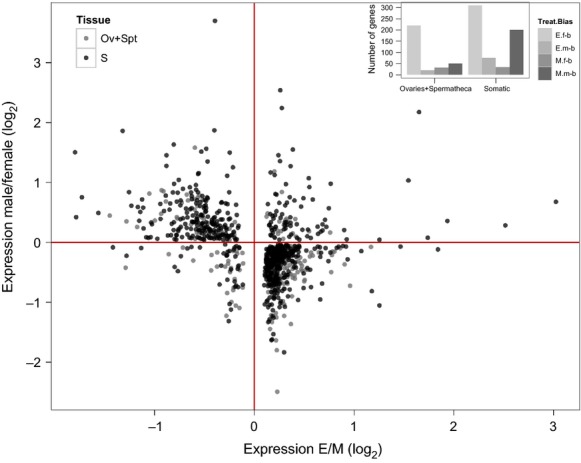
Figure 4.

Main figure: Gene expression difference between polyandrous (E) and monandrous (M) females by sex bias, separately for somatic (S) and ovary- + spermathecae-enriched genes (Ov + Spt). Insert: the numbers of differentially expressed genes upregulated in E and M treatment (Treat) by sex bias status (E.f-b = E female-biased; E.m-b = E male-biased; M.f-b = M female-biased; M.m-b = M male-biased) separately for somatic and female reproductive tissues. The figures show how the relative difference in the upregulation of female- and male-biased genes is seen for both female reproductive tract- and somatic-tissue-enriched genes. Tissue data from FlyAtlas (Chintapalli et al. 2007).
