
Figure 5.
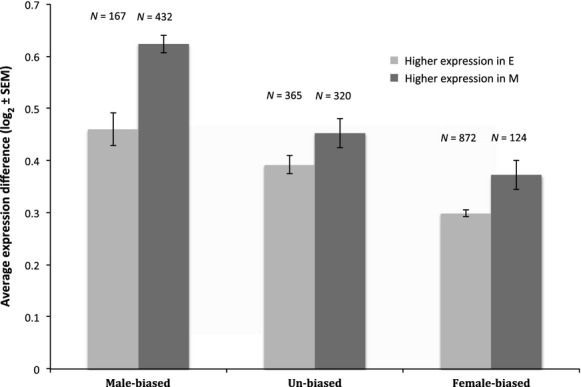
The average expression magnitude difference (with ±SE) between M and E females by sex bias (as defined in the wild-type), separately for the genes that show higher expression in E and in M.
Official websites use .gov
A
.gov website belongs to an official
government organization in the United States.
Secure .gov websites use HTTPS
A lock (
) or https:// means you've safely
connected to the .gov website. Share sensitive
information only on official, secure websites.
The average expression magnitude difference (with ±SE) between M and E females by sex bias (as defined in the wild-type), separately for the genes that show higher expression in E and in M.