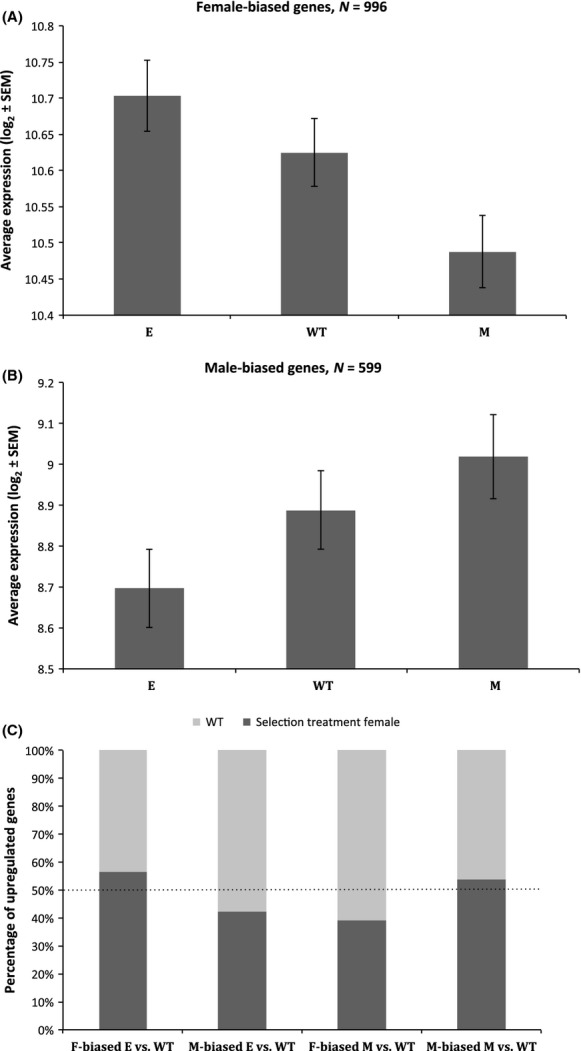
Figure 6.

Expression patterns between experimental and wild-type females for the differentially expressed genes of E and M that have a sex-biased status in the wild-type. Average expression in each female type for the female-biased genes (A) and male-biased genes (B). Percentage of the female-biased (F) and male-biased (M) genes upregulated in each of the selection treatment female groups relative to the wild-type (C).
