
Figure A1.
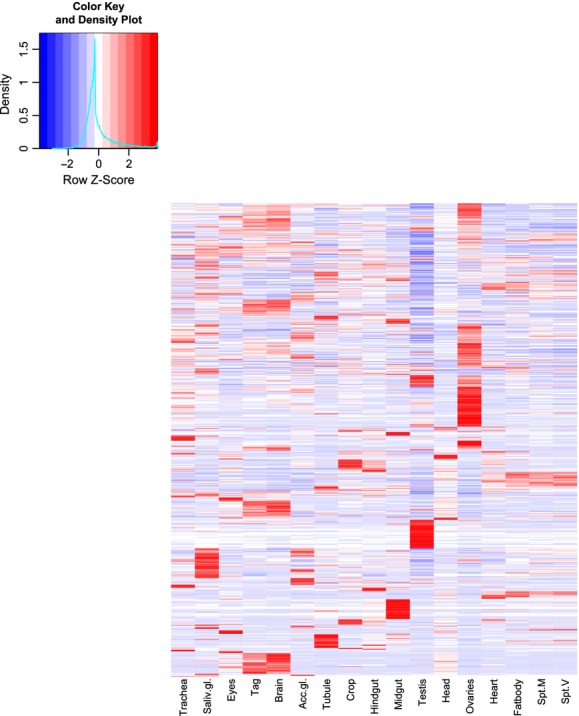
Heatmap of standardized tissue enrichment across all the differentially expressed genes (rows) of the experimental polyandrous and monandrous females. The heatmap shows in which tissue(s) the genes are enriched, highlighting those with the highest numbers of genes, and if the genes are enriched simultaneously in multiple tissues. Increasing red indicates higher enrichment value relative to the whole body (data from FlyAtlas).