
Figure A2.
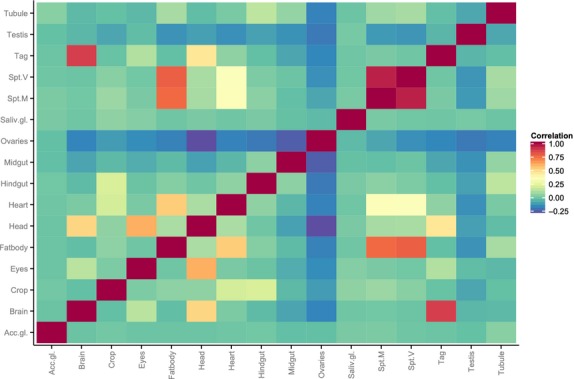
Correlation matrix of tissue expression enrichment for all the differentially expressed genes of E and M, indicating the extent of correlation between tissues for these genes.
Official websites use .gov
A
.gov website belongs to an official
government organization in the United States.
Secure .gov websites use HTTPS
A lock (
) or https:// means you've safely
connected to the .gov website. Share sensitive
information only on official, secure websites.
Correlation matrix of tissue expression enrichment for all the differentially expressed genes of E and M, indicating the extent of correlation between tissues for these genes.