
Figure 2.
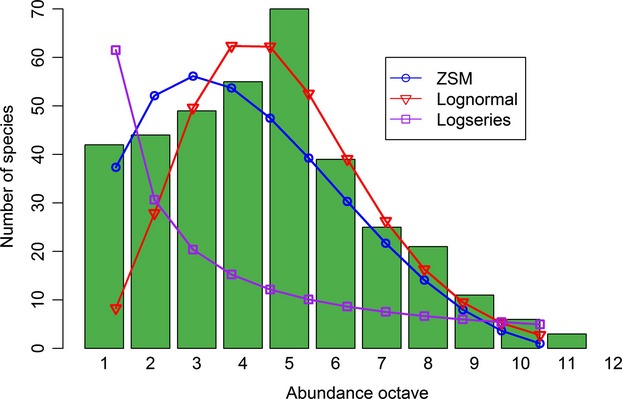
Exemplar fits of three species abundance distribution models: the zero-sum multinomial distribution of Hubbell's (2001) spatially implicit neutral model, the Poisson lognormal distribution and the logseries distribution (Fisher et al. 1943). The models are fitted to simulated data (green bars; 365 species and 22945 individuals). The three models are fitted using maximum likelihood methods. The simulated data are binned into octaves following method 3 in Gray et al. (2006): the first octave contains the number of species represented one individual, the second octave contains the number of species with 2–3 individuals, the third octave represents 4–7 individuals, and so on. The asymmetry of the ZSM enables it to provide a better fit than the other distributions to the left hand tail of the empirical distribution.