
Figure 3.
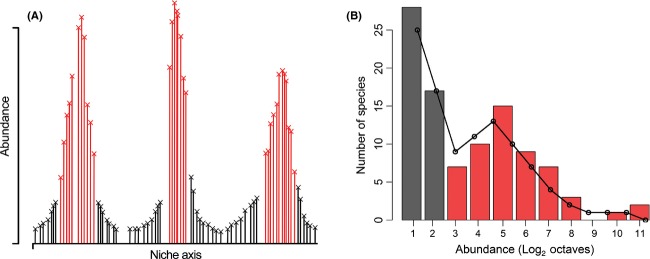
An illustration of how emergent neutrality can lead to multimodal species abundance distributions. (A) represents the abundance of a set of species as a function of a hypothetical niche axis. The species which comprise the peaks (red bars) within panel (A) are the abundant species in the community and correspond to the abundant species in the multimodal distribution (B; red bars). The species in the troughs (black bars) of panel (A) are relatively rare and correspond to the black bars in panel (B). The combination of these two sets of species in a sample results in a bimodal abundance distribution. The observed data used to construct (B) (colored bars) are from a sample of arthropod species in a fragment of native Laurisilva forest in the Azores (P.A.V. Borges, personal communication). A two-mode Poisson lognormal distribution has been fitted to the data (black line) using the functions in Dornelas and Connolly (2008). These data are used simply to provide an example of a multimodal species abundance distribution; the role of emergent neutrality in this particular system is unclear.