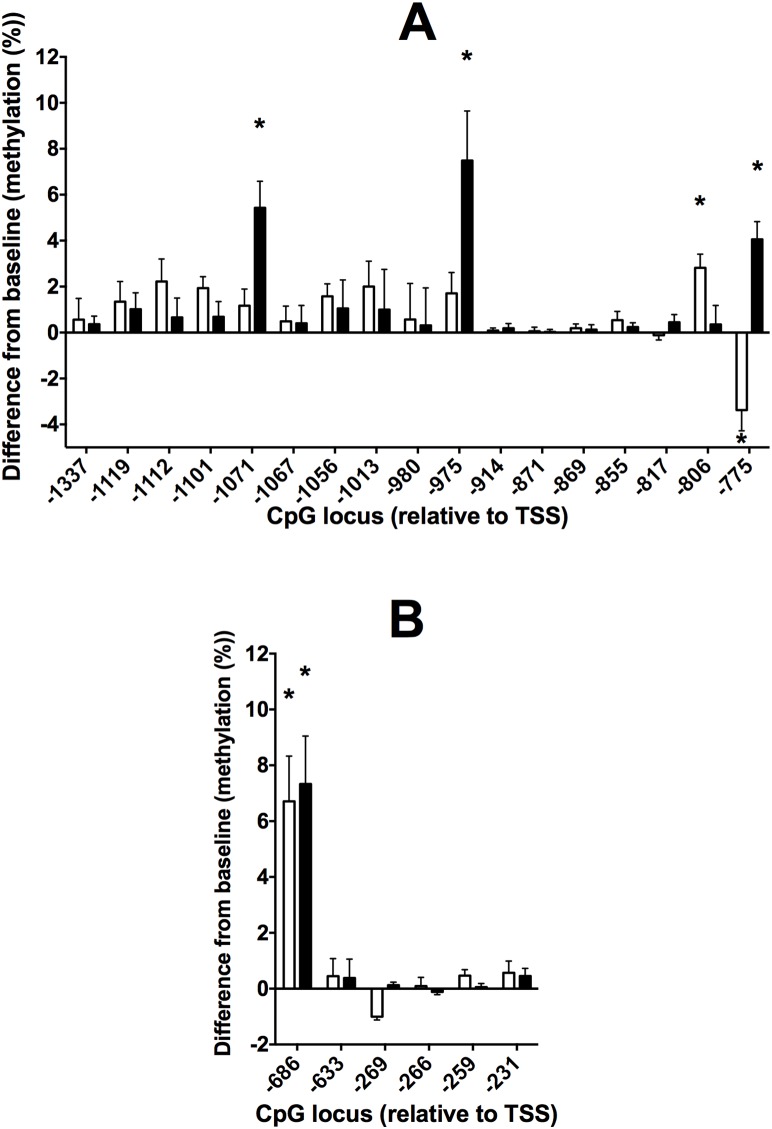
Figure 4. Values are mean ± SEM difference in the methylation of individual CpG loci from baseline in the 5′ regulatory regions of (A) FADS2 and (B) ELOVL5 in PBMCs from male (open bars) and female (closed bars) in the Study 1 cohort who consumed a n-3 LCPUFA supplement.
Numbers of subjects are listed in Table 1. Locations of individual CpG dinucleotides are relative to the transcription start site (TSS). *Means that were significantly different (P<0.05) by Student’s paired t test between baseline and end of intervention samples.

