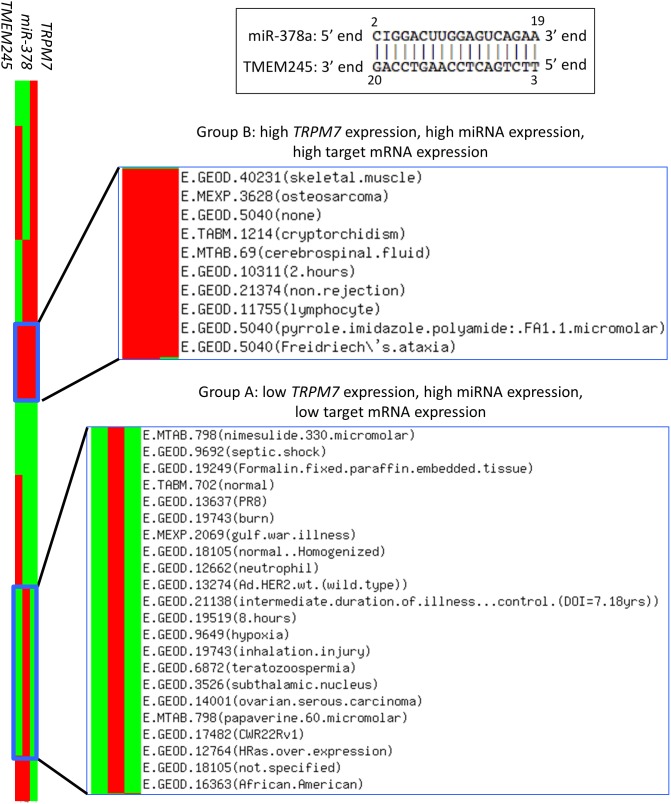
Figure 4. Expression heatmap of the cellular Mg2+ importing gene (TRPM7), miR-378, and the miR-378 target TMEM245.
The expression of miR-378 and its target TMEM245 (high complementary binding; see the upper black box) was associated with TRPM7 expression (left-most panel). From the Expression Atlas [40], we obtained 95 experiments showing significant differential expressions of TRPM7, miR-378, and TMEM245. The red and green colors indicate high and low expression in a given experiment, respectively. Group A represents studies showing high miRNA expression, low target mRNA expression, and low TRPM7 expression. Group B represents studies showing high miRNA expression, high target mRNA expression, and high TRPM7 expression. The ArrayExpress accession numbers and their experiment descriptions in Groups A and B are represented in the row names.

