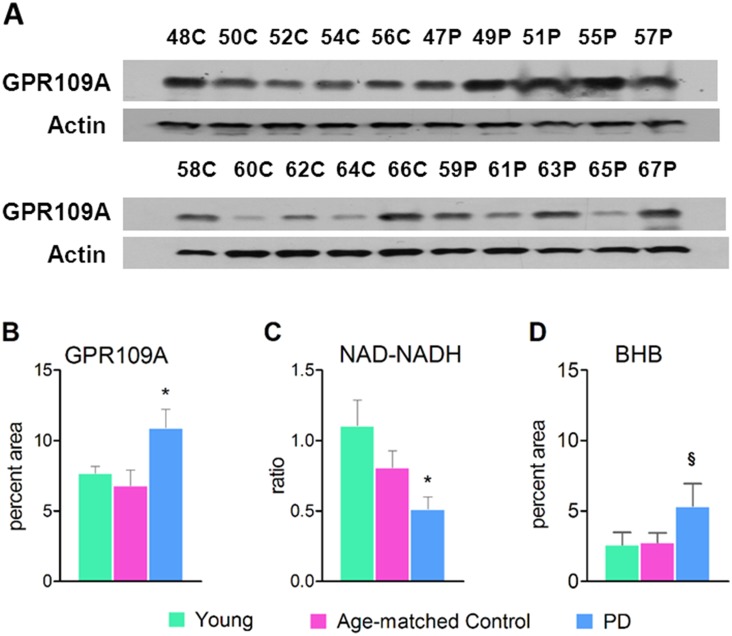
Figure 2. GPR109A expression, NAD/NADH ratio and BHB levels in blood.
(A) Representative GPR109A western blots (B) GPR109A densitometry, (C) NAD/NADH ratio and (D) BHB levels. GPR109A expression and NAD/NADH ratio were tested in the WBCs. The BHB levels were tested in the sera. Young, n = 6; Older, n = 23, PD, n = 22. *p = 0.009 between Age-matched control and PD groups. **p = 0.033 between Age-matched control and PD groups. § p = 0.071 between Age-matched control and PD groups.

