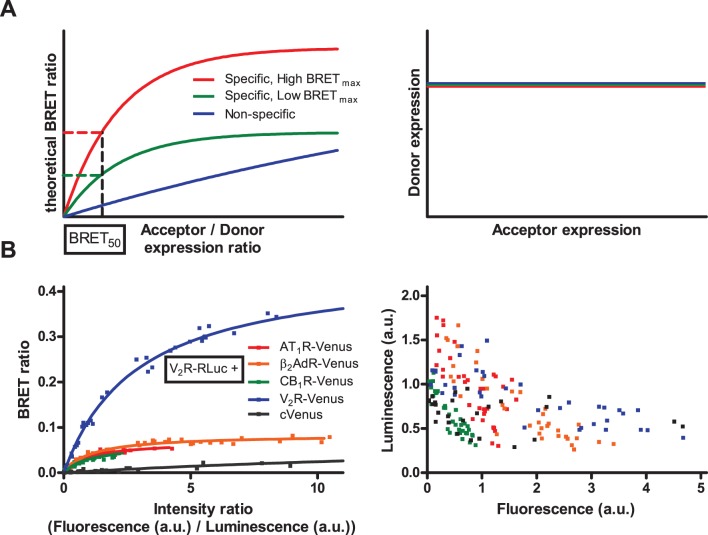
Figure 1. Classical qBRET experiments.
(A) Schematic representation of qBRET experiments (based on [12]): In qBRET experiments, constant amount of energy donor labeled receptor is coexpressed with increasing amount of acceptor labeled receptor. BRET ratio is plotted as a function of acceptor/donor expression ratio (left panel). Theoretically specific interactions result in a saturation curve (red and green), while non-specific interaction shows linear relationship (blue). The absolute value of BRET ratio is not indicative of the dimerization state of the receptors, therefore BRET50 value (acceptor/donor ratio at half-maximal BRET ratio) is used to determine the affinity of receptors to form dimers (which is the same for red and green curve, indicating the same likelihood of dimerization despite the different BRETmax values). To correctly interpret qBRET curves, donor labeled receptor expression has to be maintained constant with increasing acceptor expression (right panel). (B) HEK293 cells were transiently transfected with a constant amount V2R-RLuc (donor) coding plasmid and with increasing amounts of either AT1R-Venus, β2AdR-Venus, CB1R-Venus, V2R-Venus or cytoplasmic Venus (acceptor) coding plasmid. Various amounts of empty pcDNA3.1 plasmid was added to maintain constant total transfected plasmid amount. Total luminescence and Venus fluorescence were measured at the beginning of each experiment, and intensity ratio was calculated as fluorescence/total luminescence. Intensity ratio shows not the absolute acceptor/donor expression ratio (see Methods for further details) but is proportional with it. BRET ratio was calculated as Emission530/Emission485, and was plotted as a function of intensity ratio (left panel). Measured total luminescence was plotted as a function of measured fluorescence for the investigated donor - acceptor pairs (right panel). Curves were fitted using non-linear regression equation assuming a single binding site (GraphPad Prism). n = 3.

