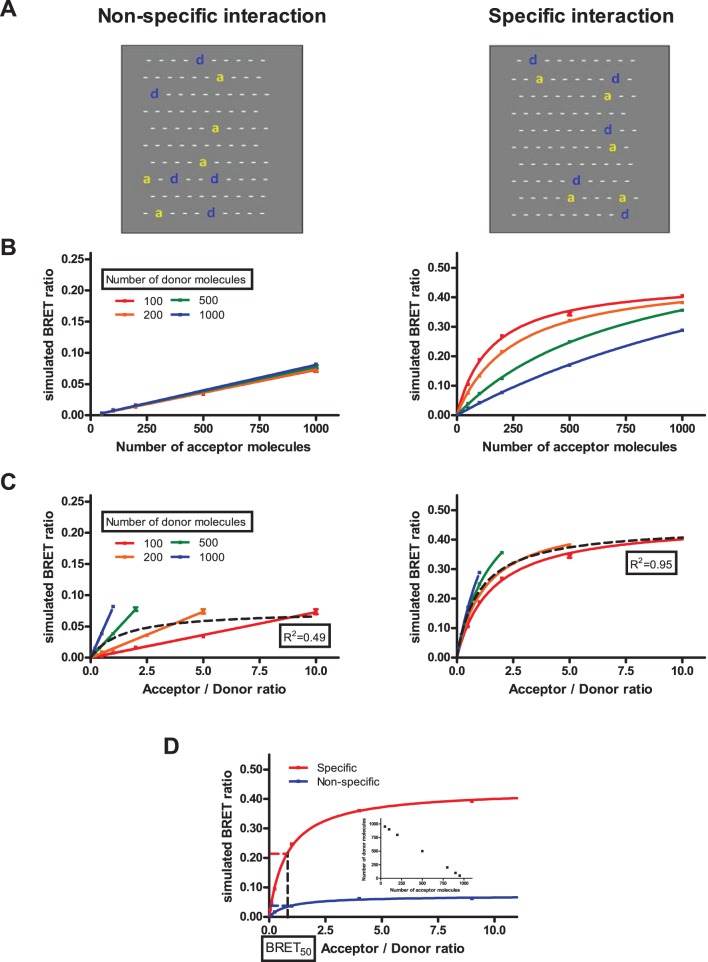
Figure 2. Monte Carlo simulations with various donor amounts.
(A) Graphical representation of our simulations: two small membrane pieces in the case of non-specific (left panel) and specific (right panel) interaction, ‘d’ and ‘a’ represents donor and acceptor molecules, respectively, while ‘−‘ indicates empty hexagons. (B and C) Numbers of donor and acceptor molecules were varied from 100 to 1000 for each. BRET ratio was calculated after 1000 simulation time steps based on the total number of neighboring donor-acceptor pairs. Simulated BRET ratio was plotted as a function of the number of acceptor molecules (B) or acceptor/donor ratio (C). Simulations were performed with association and dissociation probabilities for non-specific (left panels) and specific (right panels) interactions (Table 2). (D) Simulations performed for non-specific and specific interactions, when total amount of donor and acceptor were fixed (insert). Curves were fitted using either linear regression or non-linear regression equation assuming a single binding site (GraphPad Prism). n = 5, mean +/− SEM.

