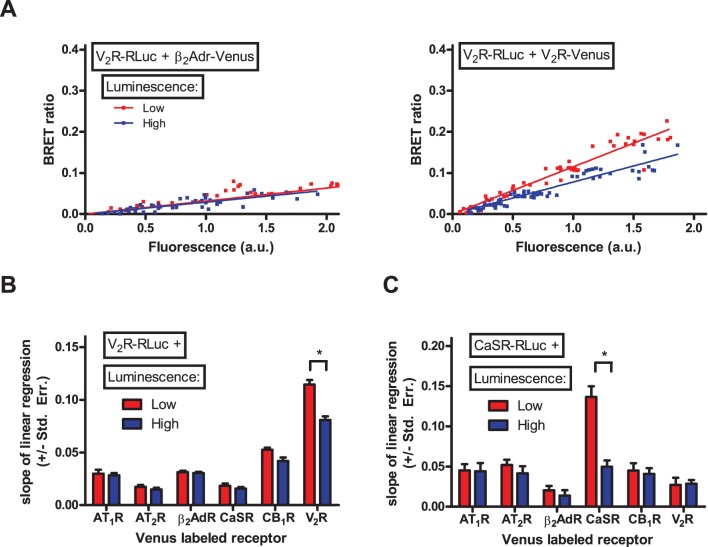
Figure 4. Dimerization of V2 vasopressin receptor and CaSR calcium sensing receptor with various other GPCRs.
HEK293 cells were transiently transfected with increasing amounts of V2R-RLuc (A and B) or CaSR-RLuc (C) and with increasing amounts of either AT1R-Venus, AT2R-Venus, β2AdR-Venus, CaSR-Venus, CB1R-Venus or V2R-Venus. Various amounts of empty pcDNA3.1 plasmid was added to maintain constant total transfected plasmid amount. Total luminescence and Venus fluorescence were measured at the beginning of each experiment. BRET ratio was calculated as Emission530/Emission485, and was plotted as a function of measured fluorescence. (A) Representative Type I plots for V2R-β2AdR interaction (left plot) and V2R-V2R interaction (right plot). Measured points were sorted into low/high luminescence groups based on the total measured luminescence (Figure S2). (B and C) The slope of linear regression was calculated for the low and high luminescence groups of different GPCR pairs, and was plotted as a column diagram. Difference between the slopes of linear regression was determined by ANCOVA. n = 3–8.

