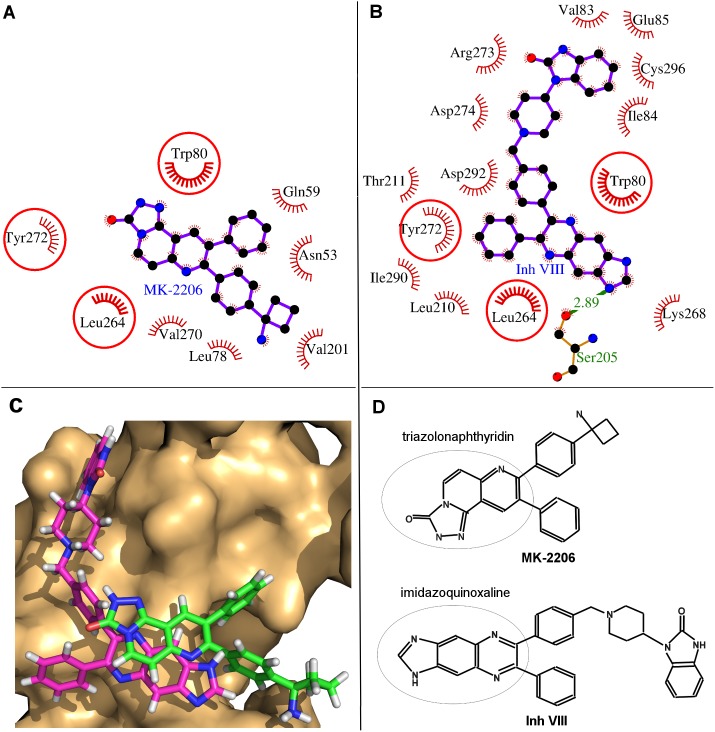
Figure 6. Comparative binding analyses of MK-2206 and inhibitor VIII.
Panels A–B: The binding of MK-2206 and inhibitor VIII are displayed. The hydrogen bond is shown as green-dashed line with indicated bond length and the residues involved in hydrophobic interactions are shown as red arcs. The interacting residues which are common for both the ligands are encircled. Panel C: The exact orientation of binding for both the ligands in the binding site of the protein is shown. Panel D: Schematic structure of MK-2206 and inhibitor VIII are shown. The three ring moieties of both the molecules are encircled.

