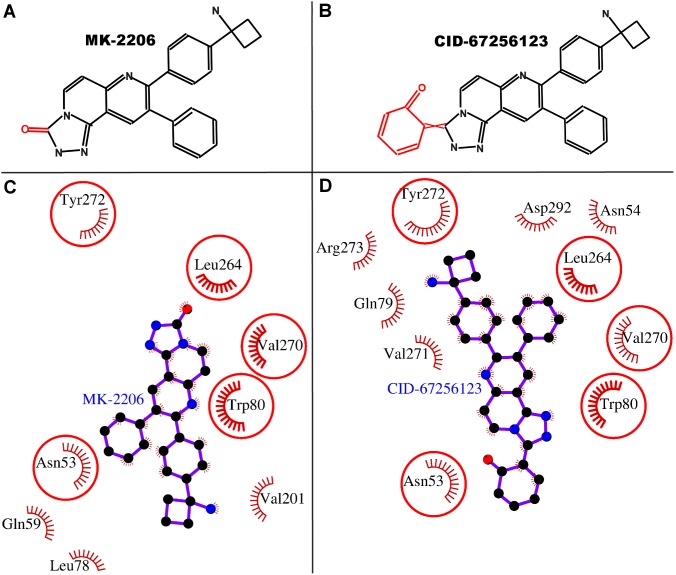
Figure 8. Comparative binding analyses of MK-2206 and its selected analog.
Panels A–B: Schematic structure of MK-2206 and its analog are shown. The only difference between the compounds is change in R2 group, shown in red on black compound-scaffold. Panel C–D: The binding of MK-2206 and its selected analog are displayed. The residues involved in hydrophobic interactions are shown as red arcs. The interacting residues which are common for both the ligands are encircled.

