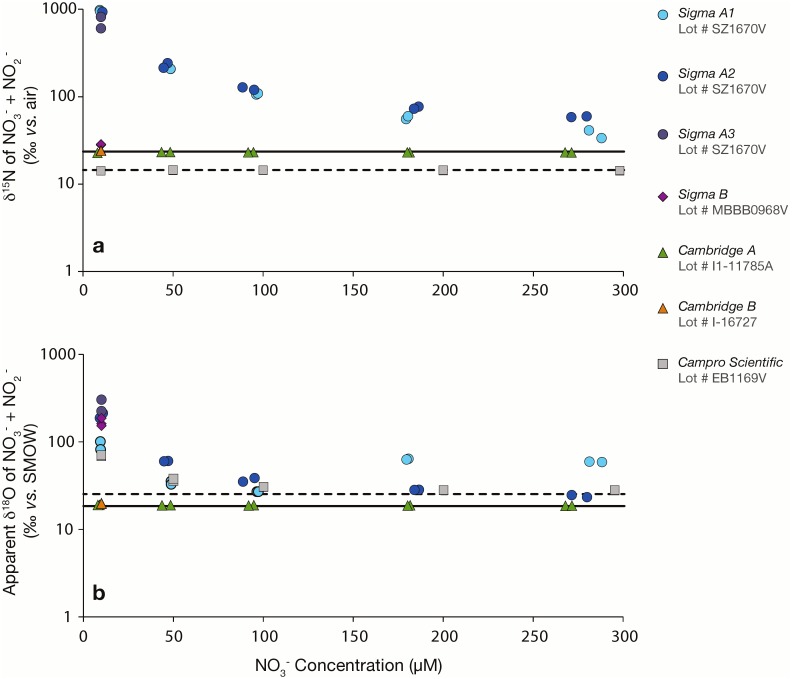
Figure 1. (a) δ15NNO3+NO2 (log scale) of nitrate solutions (10–300 µmol L−1) following equilibration with 0.1 mL 15N2 gas from lecture bottles procured from three distributors.
Solutions were 40 mL for Sigma-Aldrich and Campro Scientific equilibrations, and 100 mL for Cambridge Isotopes equilibrations. The solid line corresponds to the δ15NNO3 of the control solutions for Sigma-Aldrich and Cambridge Isotopes experiments (δ15NNO3 = 23.5±0.5‰); the dashed line corresponds to controls for Campro Scientific experiments (δ15NNO3 = 14.15±0.1‰). Paired symbols identify replicate experimental treatments. (b) Corresponding apparent δ18ONO3+NO2 of the experimental nitrate solutions. The solid line corresponds to the δ18ONO3 of control solutions for the Sigma-Aldrich and Cambridge Isotope experiments (δ18ONO3 = 18.9±0.3‰); the dashed line corresponds to controls for Campro Scientific experiments (25.4±0.3‰).

