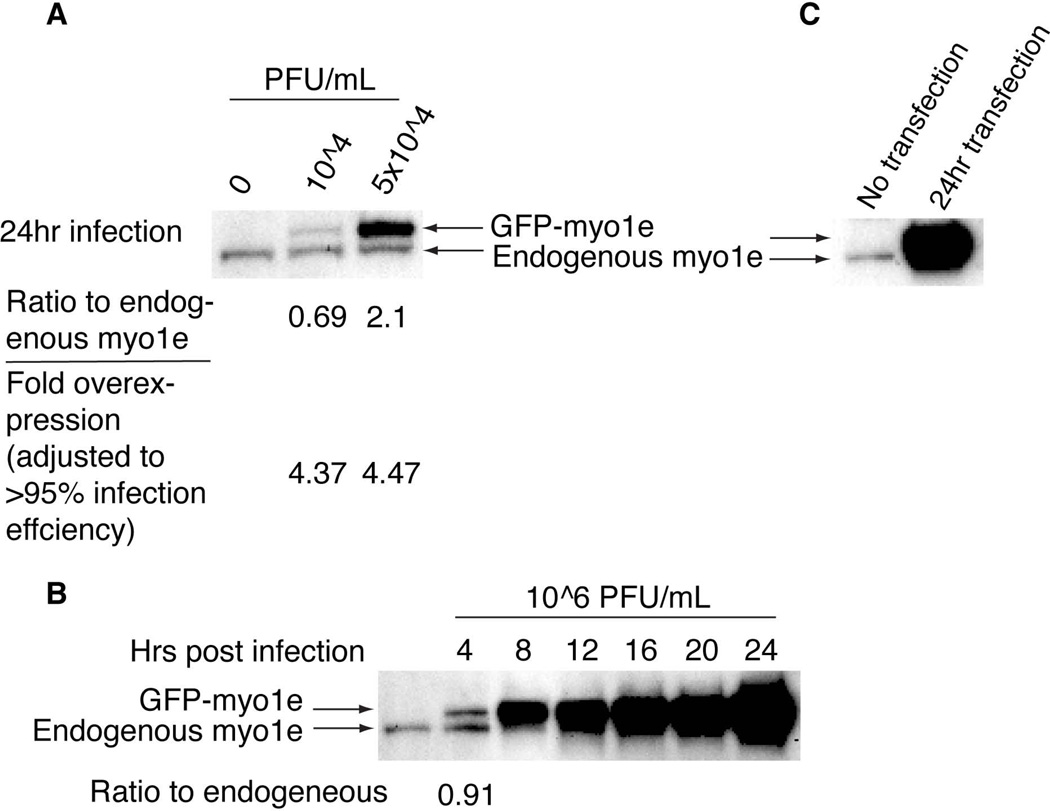
Figure 2. Western blot analysis of cell lysates prepared from differentiated podocytes infected with different concentrations of the adenoviral vector encoding GFP-myo1e.
A, wild type podocytes were infected with adenoviral vector encoding GFP-myo1e at indicated concentrations. Cells were lysed at 24 hours post-infection, and gel samples were processed for SDS-PAGE and Western blot analysis using anti-myo1e antibody. Ratio of GFP-tagged myosin to the endogenous myosin was calculated by dividing GFP fusion band intensity expression (upper band) by the intensity of the endogenous myo1e (lower band). Fold overexpression was calculated by taking into account the fraction of cells that are expected to be infected at a given adenovirus concentration. B, Cos-7 cells were transfected with GFP-myo1e plasmid. Cells were lysed 24 hours after the transfection and analyzed by Western blotting. C, wild type podocytes were infected with the adenoviral vector encoding GFP-myo1e at the concentration of 106 PFU/ml, which results in infection of >95% of cells. Cells were lysed every 4 hours post infection, and gel samples were analyzed by Western blotting.

