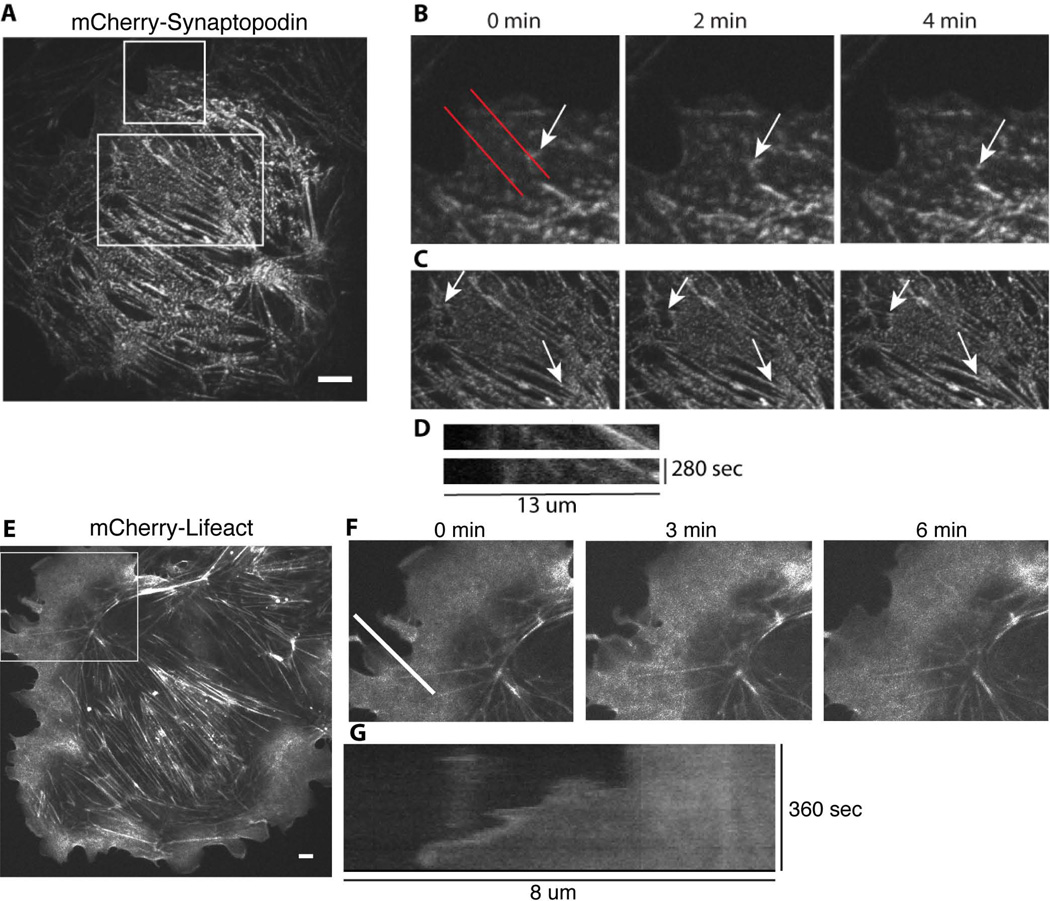
Figure 4. Visualization of podocyte cytoskeletal dynamics using live-cell imaging.
Differentiated mouse podocytes were infected with either mCherry-tagged synaptopodin (A–D, confocal images) or mCherry-tagged Lifeact (E–G, epifluorescence images). B and C, enlarged images of the boxed regions in A at the indicated time points. Arrow in B points to a synaptopodin-labeled structure undergoing retrograde flow away from the cell edge. Arrows in C, pointing to synaptopodin speckles within stress fibers, illustrate stress fiber contraction (decreasing distance between the arrows over time). D, kymographs generated using red lines in B illustrate retrograde flow of synaptopodin-labeled actin bundles. F, a time-lapse sequence showing enlarged images of the boxed region in E. G, kymograph generated based on the time-lapse sequence shown in F illustrates protrusion of the cell edge. Scale bar: 10 µm.

